当前位置: 首页> 专利交易> 详情页
    待售中

    燃料电池催化层的性能分析方法、装置、设备及存储介质[ZH]

    专利编号: ZL202609180127

    收藏

    拟转化方式: 转让;普通许可;独占许可;排他许可;开放许可

    交易价格:面议

    专利类型:发明专利

    法律状态:授权

    技术领域:新能源汽车

    发布日期:2026-09-18

    发布有效期: 2026-09-18 至 2041-09-23

    专利顾问 — 王老师

    电话咨询

    咨询电话

    13760886304

    专利基本信息
    >
    申请号 CN202111115921.9 公开号 CN113889646A
    申请日 2021-09-23 公开日 2022-01-04
    申请人 中汽创智科技有限公司 专利授权日期 2023-09-22
    发明人 段康俊;张娅;杨雨 专利权期限届满日 2041-09-23
    申请人地址 211100 江苏省南京市江宁区秣陵街道胜利路88号 最新法律状态 授权
    技术领域 新能源汽车 分类号 H01M8/04298
    技术效果 可靠性 有效性 有效(授权、部分无效)
    专利代理机构 广州三环专利商标代理有限公司 44202 代理人 郝传鑫;贾允
    专利技术详情
    >
    01

    专利摘要

    本申请涉及燃料电池催化层的性能分析方法、装置、设备及存储介质,该方法包括:基于催化层的扫描图像构建催化层的数值模型;基于数值模型,利用格子玻尔兹曼方法模拟水动力行为,得到固相分布数据和液态水的流动特征数据;液态水的流动特征数据包括液态水在催化层中的迁移与再分布的特征数据;基于液态水的流动特征数据,利用孔尺度模型,确定数值模型中气体的扩散率和带电物质的导电率;根据固相分布数据和基于局部饱和度的有效因子确定活化比表面积;基于液态水在催化层中的迁移与再分布的特征数据、气体的扩散率、带电物质的导电率和活化比表面积,得到催化层的性能参数。如此,可以准确评估燃料电池催化层的性能状态。
    展开 >
    02

    专利详情

    技术领域

    本申请涉及燃料电池技术领域,特别涉及一种燃料电池催化层的性能分析方法、装置、设备及存储介质。

    背景技术

    质子交换膜燃料电池(protonexchange membrane fuel cell,PEMFC)是一种高效的能量转换装置,能够将储存在氢燃料和氧化剂中的化学能通过电化学反应的方式直接转换为电能,具有绿色环保、高比能量、低温快速启动和高平稳运行的特点。

    PEMFC由三个主要部件组成:膜电极组件(Membrane ElectrodeAssemblies,MEA),阴(Cathode)阳(Anode)多孔电极和集流双极板(BipolarPate,BP)。在阳极催化层处,氢气通过多孔电极扩散到膜电极表面并在铂(Pt)催化剂的作用下发生氢的氧化反应(HydrogenOxidation Reaction,HOR)转换成质子和电子。发生电化学反应的膜电极组件是PEMFC的核心,最常用类型的聚合物交换膜具有高带隙(Band Gap)结构,使之成为电子的绝缘体。因此,电子只能通过多孔电极以及双极集流板经由外部电路从阳极电极转移到阴极。在阴极催化层处,分别通过聚合物膜和外部电路迁移的质子和电子以及从阴极流道扩散而来的氧气聚集在一起并发生氧的还原反应(Oxygen Reduction Reaction,ORR)。水是该反应唯一的副产物,将从催化层渐渐向微孔层和气体扩散层移动,最终通过集流板中的气体流道离开,由汽车排气管排出,可以实现汽车尾气零排放的目的。

    虽然PEMFC具有优越的工作性能以及环境友好性,但仍然存在许多关键性的技术问题阻碍了其全面商业化的脚步,例如,水管理、热管理、耐久性以及高效催化技术问题。PEMFC中的水管理问题涵盖了组成电池的每一个部件:质子交换膜(Proton ExchangeMembrane,PEM)、催化层(Catalyst Layer,CL)、微孔层(Micro Porous Layer,MPL)、气体扩散层(Gas DiffusionLayer,GDL)以及气体流道。

    燃料电池内水的运输对系统性能有着显著影响。为了保持PEMFC中的高质子传导性,聚合物膜必须保持有一定量的含水率以避免膜干涸,但过多的水会引起催化层、微孔层、气体扩散层或气体通道内出现“水淹”现象,抑制气体反应物运输到反应位点,并使得部分活性位点失活,降低了装置的效率。

    因此,恰当的水管理是提高PEMFC工作性能的关键技术,特别是对于阴极各组件来说。但是,在目前的燃料电池仿真手段中,尚未有一种有效的方式去评估水淹对电极性能的影响。

    发明内容

    本申请实施例提供了一种燃料电池催化层的性能分析方法、装置、设备及存储介质,可以较为真实的去模拟不同水分布条件下的催化层的微观形态,通过引入有效因子来修正ECSA,以反映水淹对催化剂粒子活化所带来的负面影响,从而可以准确评估燃料电池催化层的性能状态。

    一方面,本申请实施例提供了一种燃料电池催化层的性能分析方法,包括:

    基于催化层的扫描图像构建催化层的数值模型;

    基于数值模型,利用格子玻尔兹曼方法模拟水动力行为,得到固相分布数据和液态水的流动特征数据;液态水的流动特征数据包括液态水在催化层中的迁移与再分布的特征数据;

    基于液态水的流动特征数据,利用孔尺度模型,确定数值模型中气体的扩散率和带电物质的导电率;

    根据固相分布数据和基于局部饱和度的有效因子确定活化比表面积;

    基于液态水在催化层中的迁移与再分布的特征数据、气体的扩散率、带电物质的导电率和活化比表面积,得到催化层的性能参数。

    可选的,扫描图像为通过聚焦离子束扫描电子显微镜对催化层进行采集得到的灰度图像;

    基于催化层的扫描图像构建催化层的数值模型,包括:

    确定催化层中各组分在灰度图像中对应的分布区域;

    基于各组分在灰度图像中对应的分布区域,在预设计算空间中,构建催化层的数值模型。

    可选的,有效因子根据下述公式(1)确定:

    其中,β为有效因子;S表示局部饱和度,表征基于预设计算空间中每个局部计算空间的液态水含量;

    根据固相分布数据和基于局部饱和度的有效因子确定活化比表面积,包括:

    根据固相分布数据和基于局部饱和度的有效因子,基于下述公式(2)确定活化比表面积:

    其中,aV表示活化比表面积;SPt和V均为固相分布数据,其中,SPt表示催化剂粒子被聚合物电解质所覆盖的面积,V表示碳载铂的体积。

    可选的,方法还包括:

    建立包含催化层的单电池的三维宏观模型;

    基于三维宏观模型和催化层的性能参数,确定单电池的性能曲线;性能曲线包括电池电压与电池平均电流密度的关系曲线。

    另一方面,本申请实施例提供了一种燃料电池催化层的性能分析装置,包括:

    构建模块,被配置为执行基于催化层的扫描图像构建催化层的数值模型;

    第一确定模块,被配置为执行基于数值模型,利用格子玻尔兹曼方法模拟水动力行为,得到固相分布数据和液态水的流动特征数据;液态水的流动特征数据包括液态水在催化层中的迁移与再分布的特征数据;

    第二确定模块,被配置为执行基于液态水的流动特征数据,利用孔尺度模型,确定数值模型中气体的扩散率和带电物质的导电率;

    第三确定模块,被配置为执行根据固相分布数据和基于局部饱和度的有效因子确定活化比表面积;

    第四确定模块,被配置执行基于液态水在催化层中的迁移与再分布的特征数据、气体的扩散率、带电物质的导电率和活化比表面积,得到催化层的性能参数。

    可选的,扫描图像为通过聚焦离子束扫描电子显微镜对催化层进行采集得到的灰度图像;

    构建模块,被配置为执行:

    确定催化层中各组分在灰度图像中对应的分布区域;

    基于各组分在灰度图像中对应的分布区域,在预设计算空间中,构建催化层的数值模型。

    可选的,还包括第五确定模块,被配置为执行:根据下述公式(1)确定有效因子:

    其中,β为有效因子;S表示局部饱和度,表征基于预设计算空间中每个局部计算空间的液态水含量;

    第三确定模块,被配置为执行:

    根据固相分布数据和基于局部饱和度的有效因子,基于下述公式(2)确定活化比表面积:

    其中,aV表示活化比表面积;SPt和V均为固相分布数据,其中,SPt表示催化剂粒子被聚合物电解质所覆盖的面积,V表示碳载铂的体积。

    可选的,装置还包括:

    建立模块,被配置为执行建立包含催化层的单电池的三维宏观模型;

    第六确定模块,被配置为执行基于三维宏观模型和催化层的性能参数,确定单电池的性能曲线;性能曲线包括电池电压与电池平均电流密度的关系曲线。

    另一方面,本申请实施例提供了一种设备,设备包括处理器和存储器,存储器中存储有至少一条指令或至少一段程序,至少一条指令或至少一段程序由处理器加载并执行上述的燃料电池催化层的性能分析方法。

    另一方面,本申请实施例提供了一种计算机存储介质,存储介质中存储有至少一条指令或至少一段程序,至少一条指令或至少一段程序由处理器加载并执行以实现上述的燃料电池催化层的性能分析方法。

    本申请实施例提供的燃料电池催化层的性能分析方法、装置、设备及存储介质具有如下有益效果:

    基于催化层的扫描图像构建催化层的数值模型;基于数值模型,利用格子玻尔兹曼方法模拟水动力行为,得到固相分布数据和液态水的流动特征数据;液态水的流动特征数据包括液态水在催化层中的迁移与再分布的特征数据;基于液态水的流动特征数据,利用孔尺度模型,确定数值模型中气体的扩散率和带电物质的导电率;根据固相分布数据和基于局部饱和度的有效因子确定活化比表面积;基于液态水在催化层中的迁移与再分布的特征数据、气体的扩散率、带电物质的导电率和活化比表面积,得到催化层的性能参数。本申请可以较为真实的去模拟不同水分布条件下的催化层的微观形态,通过引入有效因子来修正ECSA,以反映水淹对催化剂粒子活化所带来的负面影响,从而可以准确评估燃料电池催化层的性能状态。

    附图说明

    为了更清楚地说明本申请实施例中的技术方案,下面将对实施例描述中所需要使用的附图作简单地介绍,显而易见地,下面描述中的附图仅仅是本申请的一些实施例,对于本领域普通技术人员来讲,在不付出创造性劳动的前提下,还可以根据这些附图获得其他的附图。

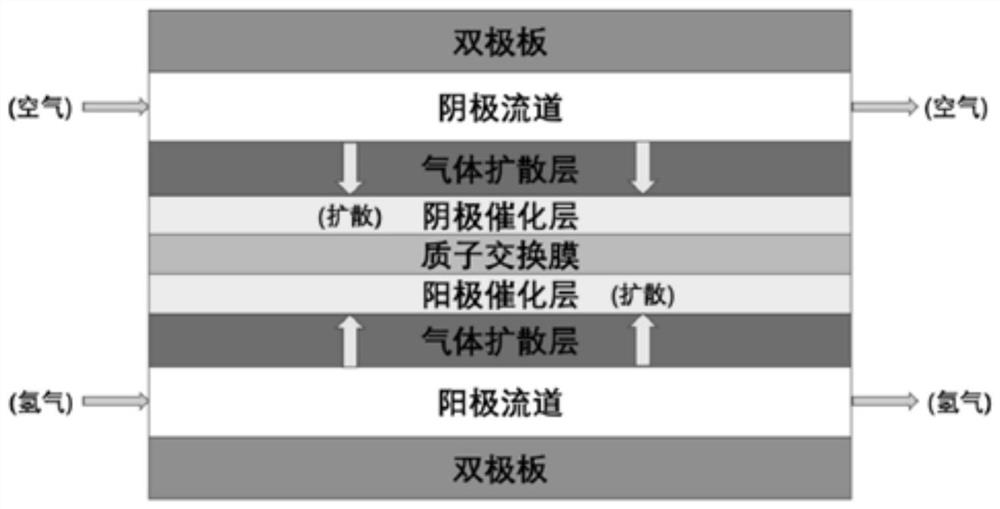
    图1是本申请实施例提供的一种PEMFC单电池结构示意图;

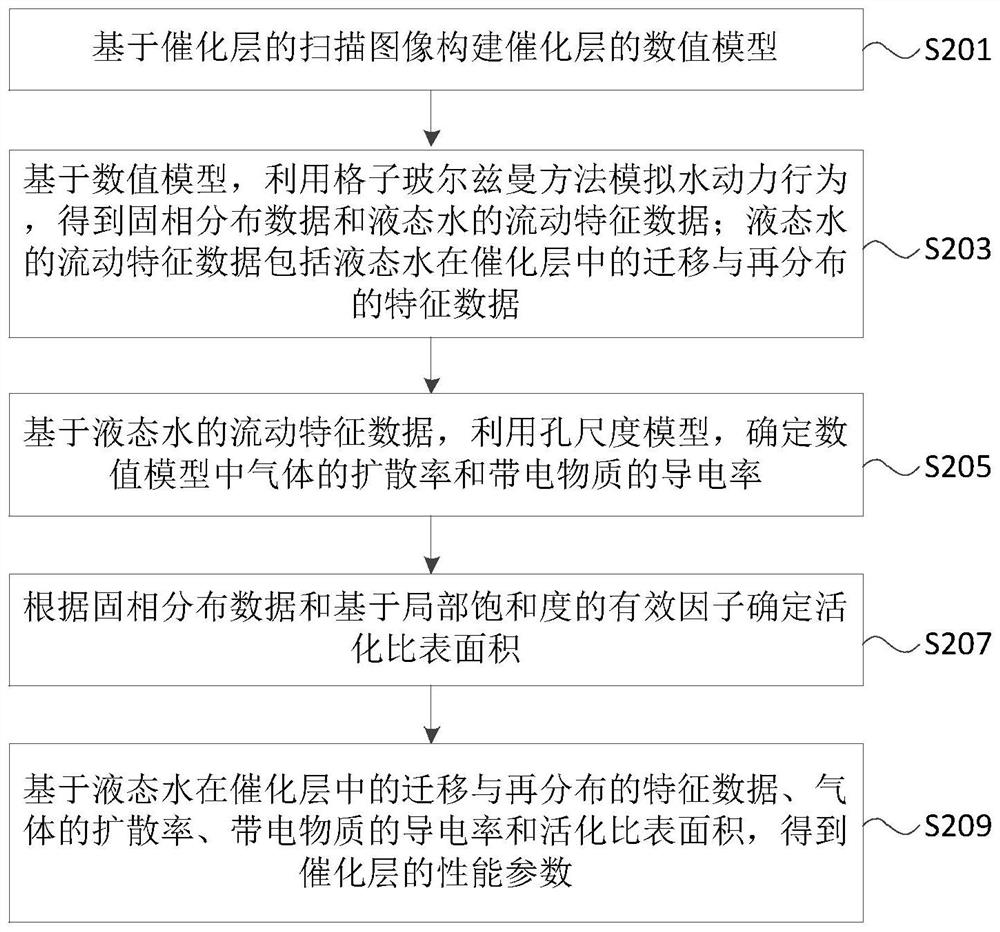
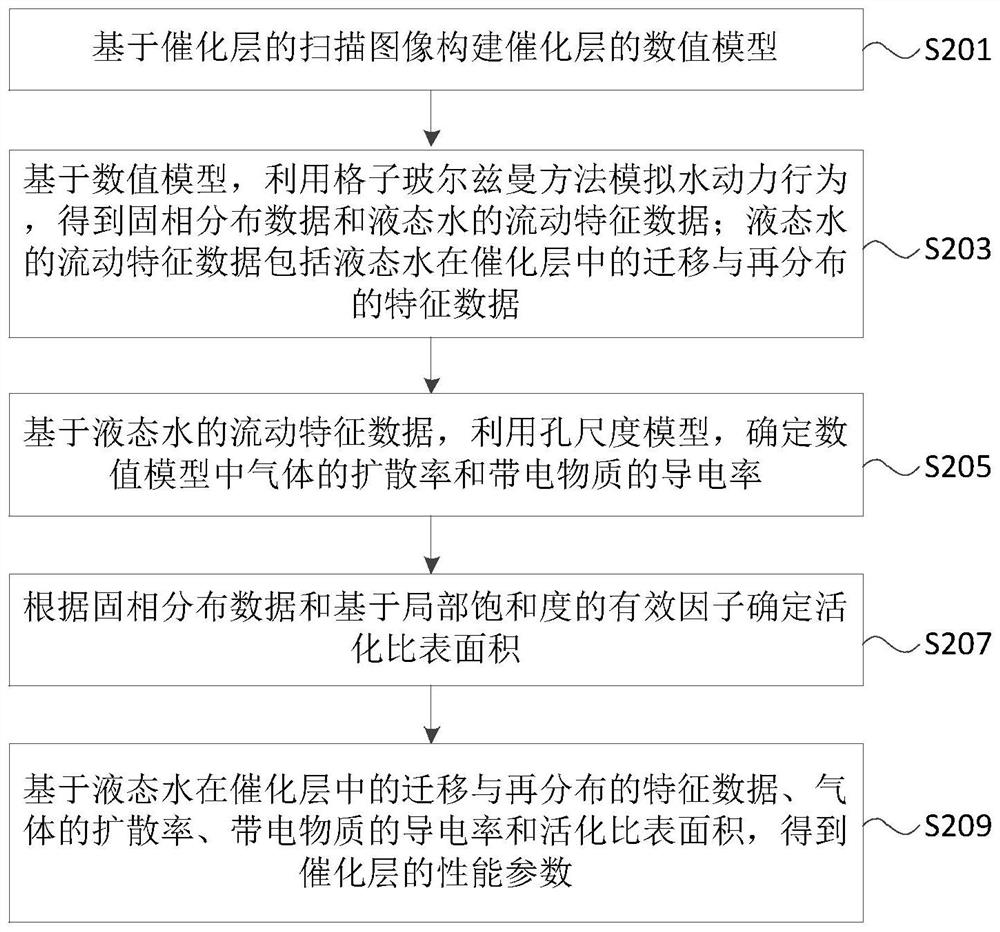
    图2是本申请实施例提供的一种燃料电池催化层的性能分析方法的流程示意图;

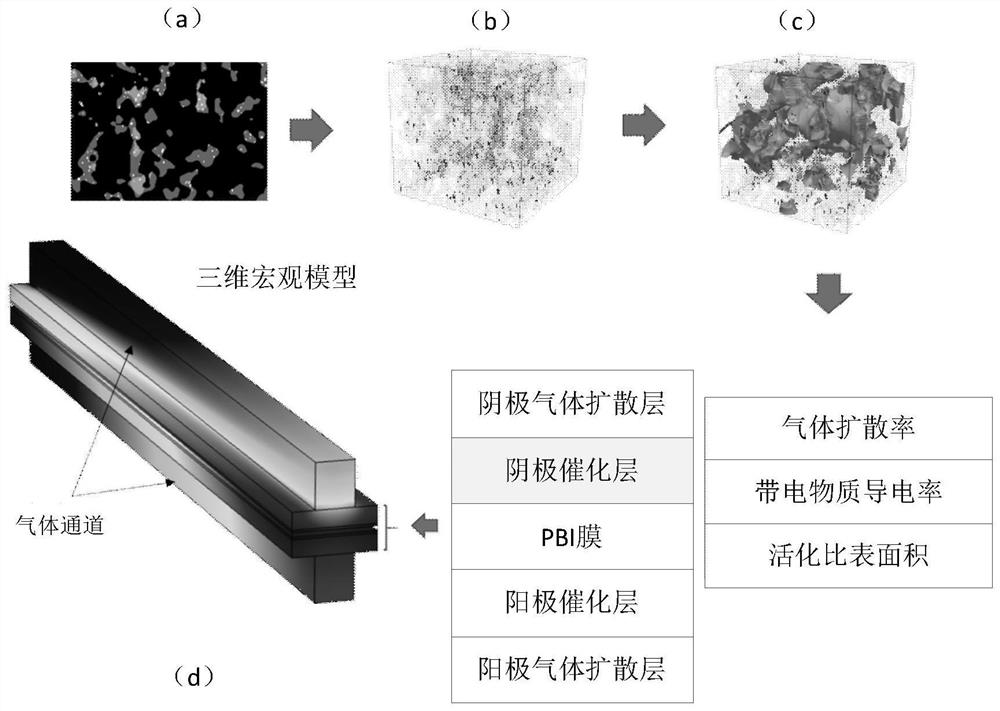
    图3是本申请实施例提供的一种燃料电池催化层的性能分析过程示意图;

    图4是本申请实施例提供的一种燃料电池催化层的性能分析装置的结构示意图;

    图5是本申请实施例提供的一种燃料电池催化层的性能分析方法的服务器的硬件结构框图。

    具体实施方式

    下面将结合本申请实施例中的附图,对本申请实施例中的技术方案进行清楚、完整地描述,显然,所描述的实施例仅仅是本申请一部分实施例,而不是全部的实施例。基于本申请中的实施例,本领域普通技术人员在没有做出创造性劳动的前提下所获得的所有其他实施例,都属于本申请保护的范围。

    需要说明的是,本申请的说明书和权利要求书及上述附图中的术语“第一”、“第二”等是用于区别类似的对象,而不必用于描述特定的顺序或先后次序。应该理解这样使用的数据在适当情况下可以互换,以便这里描述的本申请的实施例能够以除了在这里图示或描述的那些以外的顺序实施。此外,术语“包括”和“具有”以及他们的任何变形,意图在于覆盖不排他的包含,例如,包含了一系列步骤或单元的过程、方法、系统、产品或服务器不必限于清楚地列出的那些步骤或单元,而是可包括没有清楚地列出的或对于这些过程、方法、产品或设备固有的其它步骤或单元。

    图1是本申请实施例提供的一种PEMFC单电池结构示意图,包括质子交换膜、阳极/阴极催化层、气体扩散层、阳极/阴极流道以及双极板。其中,气体扩散层主要由碳纤维制成,起传导电子的作用。催化层由四个主要元素组成:球状石墨,起转移电子的作用;离子聚合物,起传导质子的作用;铂催化剂,提供电化学反应位点;孔隙,有利于阳极和阴极的反应物与生成物(如氧气,水蒸气和液态水)的运输。

    与燃料电池仿真实验直接相关的性能参数包括渗透率、孔隙率、电导率、气体扩散率和电化学活化比表面积(electrochemical active surface area,ECSA)。例如,催化层需要提供电子和质子传输途径,反应气体的可及性,对HOR和ORR的高催化活性,以及足够高的ECSA。这些参数都有相应的专用设备和实验方法可以测量,但是对实验设备,场地条件都有较高的要求。对于一般研究人员来说,很难具有相应的实验条件,成本较高。因此,通过模拟的手段去测试电极性能变得很有意义。它能协助燃料电池仿真实验的进行,提高仿真模拟的准确性,从而达到节省大量时间和金钱成本的目的。

    此外,在目前的燃料电池宏观仿真研究中,多孔催化层的性能参数都是通过查阅文献或者人为调参来确定,与实际案例的匹配度不高,其忽略了不同工况条件下多孔电极孔尺度层面的变化对电极性能的影响。本申请通过仿真的方式,较为真实的去模拟不同工况条件下的催化层微观形态,然后去评估该条件下催化层的性能参数,从而可以提高燃料电池性能仿真实验的准确度。

    以下介绍本申请一种燃料电池催化层的性能分析方法的具体实施例,图2是本申请实施例提供的一种燃料电池催化层的性能分析方法的流程示意图,本说明书提供了如实施例或流程图的方法操作步骤,但基于常规或者无创造性的劳动可以包括更多或者更少的操作步骤。实施例中列举的步骤顺序仅仅为众多步骤执行顺序中的一种方式,不代表唯一的执行顺序。具体的如图2所示,该方法可以包括:

    在步骤S201中,基于催化层的扫描图像构建催化层的数值模型。

    本申请实施例中,由燃料电池中水动力行为的实验观察得知,液态水的动力学行为和传输过程会对PEMFC各组件的性能和耐久性产生显著的影响,尤其是对于阴极催化层。因此,理解PEMFC各组件中的两相传输过程对于电池的水管理和工作性能起着至关重要的作用。

    由于在PEMFC多孔电极中发生的基本微尺度传输现象无法通过传统的宏观流动模拟观察,需要使用孔隙尺度模拟技术来更加准确地描述,因此,需要重建这些多孔介质(如GDL、MPL和CL)的微观结构。正确表征PEMFC催化层的微观结构是充分理解传输现象的先决条件。

    因而,本申请实施例中,可以使用高精度的聚焦离子束扫描电子显微镜(FIB-SEM)对催化层样品进行扫描成像,然后基于扫描得到的催化层的扫描图像来构建催化层的数值模型。

    本申请其他实施例中,也可以通过X射线断层扫描逐步采集2D图像,对采集的图像进行处理后,构建催化层的数值模型;或者,还可以采用随机四参数生长方法(QuartetStructure Gencration Set,QSGS)随机重构催化层的数值模型。

    一种可选的实施方式中,扫描图像为通过聚焦离子束扫描电子显微镜对催化层进行采集得到的灰度图像;则,上述步骤S201可以包括以下步骤:

    确定催化层中各组分在灰度图像中对应的分布区域;

    基于各组分在灰度图像中对应的分布区域,在预设计算空间中,构建催化层的数值模型。

    具体的,将催化层的原始灰度图像进行处理并转换为8位图像,然后对灰度图像进行像素分割以区分催化层中各组分:孔、碳载体、粘合剂和铂催化剂的分布区域,不同组分对应的灰度像素值不同,其中,碳载体对应的灰度像素值为70至100,粘合剂对应的灰度像素值为155,铂对应的灰度像素值为255,孔隙对应的灰度像素值为0。请参阅图3,图3中的(a)是本申请实施例提供的一种催化层的灰度图像的示意图,图3中的(b)是本申请实施例提供的一种催化层的数值模型的示意图,该数值模型表征真实催化层的几何形貌,其中,数值模型对应的预设计算空间的大小为200×200×200,且该重构的催化层几何在计算域中仅具有两个固相(碳载体和Pt)。

    在步骤S203中,基于数值模型,利用格子玻尔兹曼方法模拟水动力行为,得到固相分布数据和液态水的流动特征数据;液态水的流动特征数据包括液态水在催化层中的迁移与再分布的特征数据。

    格子玻尔兹曼方法(lattice Boltzmann method,LBM)是一种将宏观模型和微观模型联系起来的介观模拟方法。

    本申请实施例中,利用该方法研究催化层中的两相流问题,模拟催化层中水动力行为,如图3中的(c)所示;如此,可以得到不同工况下的固相分布数据和液态水的流动特征数据,不同工况指的是水分布的条件不同,不同条件下催化层中的水含量不同;液态水的流动特征数据包括液态水在催化层中的迁移与再分布的特征数据。

    在步骤S205中,基于液态水的流动特征数据,利用孔尺度模型,确定数值模型中气体的扩散率和带电物质的导电率。

    本申请实施例中,基于液态水的流动特征数据,结合孔尺度模型(pore scalemodel,PSM)来确定不同水的含量和其分布形式下,数值模型中气体的扩散率和带电物质的导电率。

    在步骤S207中,根据固相分布数据和基于局部饱和度的有效因子确定活化比表面积。

    其中活化比表面积(ECSA)是指电化学活性表面积,即参与电化学反应的有效面积。ECSA通常是基于LBM的输出结果中的固相分布数据得到,ECSA被定义为被水覆盖的铂粒子的表面积和碳载铂体积之比。

    本申请实施例中,经验证,水与催化剂粒子的接触程度决定了ECSA的大小,即水含量和其分布形式会影响ECSA。因此,本申请在确定ECSA时引入一个有效因子来修正ECSA,以反映水淹对催化剂粒子活化所带来的负面影响。

    一种可选的实施方式中,有效因子根据下述公式(1)确定:

    其中,β为有效因子;S表示局部饱和度,表征基于预设计算空间中每个局部计算空间的液态水含量;例如,将预设计算空间划分为8×8×8个局部计算空间,每个局部计算空间的大小为25×25×25。

    对应的,上述步骤S207中,可以包括:

    根据固相分布数据和基于局部饱和度的有效因子,基于下述公式(2)确定活化比表面积:

    其中,aV表示活化比表面积;SPt和V均为固相分布数据,其中,SPt表示催化剂粒子被聚合物电解质所覆盖的面积,V表示碳载铂的体积。

    在步骤S209中,基于液态水在催化层中的迁移与再分布的特征数据、气体的扩散率、带电物质的导电率和活化比表面积,得到催化层的性能参数。

    本申请实施例中,液态水在催化层中的迁移与再分布的特征数据、气体的扩散率、带电物质的导电率和活化比表面积,均可以表征为催化层的性能参数。

    进一步地,可以将上述催化层的性能参数进行整合,与单电池宏观模型结合,进一步确定单电池的性能。一种可选的实施方式中,本申请方法还包括:

    建立包含催化层的单电池的三维宏观模型;

    基于三维宏观模型和催化层的性能参数,确定单电池的性能曲线;性能曲线包括电池电压与电池平均电流密度的关系曲线。

    其中,电池电压与电池平均电流密度的关系曲线用于表征单电池的性能。

    具体的,三维宏观模型如图3中的(d)所示,由膜电极组件和阳极/阴极气体通道组成。在得到阴极催化层的各项性能参数(气体的扩散率、带电物质的导电率和活化比表面积)之后,将其与单电池宏观模型进行结合,进一步可以确定单电池的性能。如此,可以大大减少实验的时间和金钱成本,并且可以有效提高单电池仿真实验的准确性。

    综上,本申请实施例中基于催化层的扫描图像重构得到催化层的三维数值模型后,采用格子玻尔兹曼方法研究催化层几何形貌中的两相流问题,模拟水动力行为,得到固相分布数据和液态水的流动特征数据,其次,利用孔尺度模型确定数值模型中气体的扩散率和带电物质的导电率,并通过有效因子对ECSA进行修正,以反映水淹对催化剂粒子活化所带来的负面影响,从而可以更加准确的表征多孔电极的催化能力;最终得到的催化层的性能参数与单电池三维宏观模型进行结合以进一步分析单电池的性能,如此,可以提高燃料电池性能仿真实验的准确度。

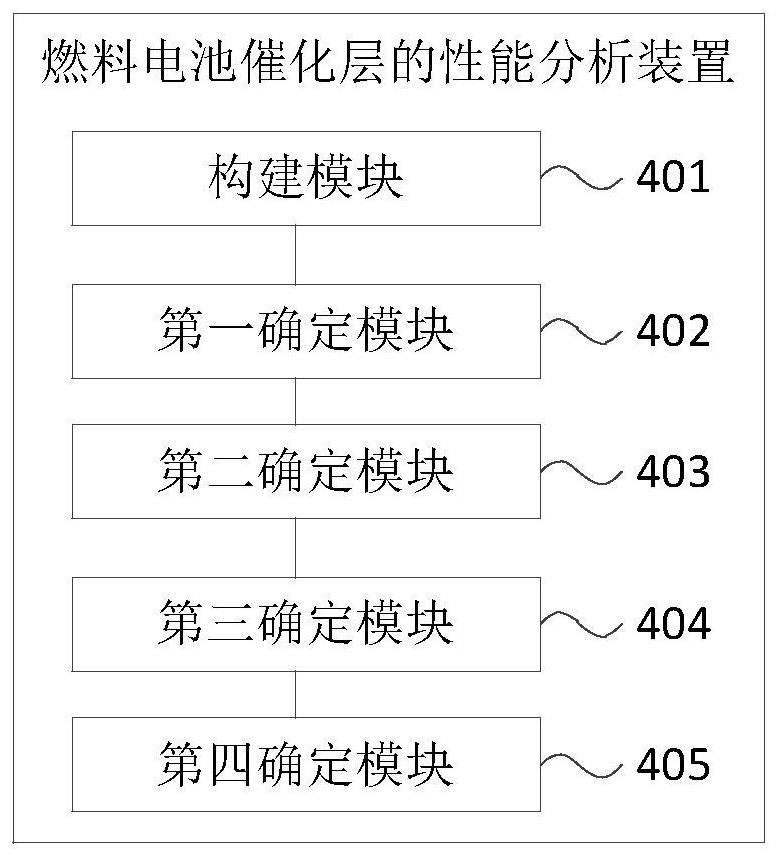
    本申请实施例还提供了一种燃料电池催化层的性能分析装置,图4是本申请实施例提供的一种燃料电池催化层的性能分析装置的结构示意图,如图4所示,该装置包括:

    构建模块401,被配置为执行基于催化层的扫描图像构建催化层的数值模型;

    第一确定模块402,被配置为执行基于数值模型,利用格子玻尔兹曼方法模拟水动力行为,得到固相分布数据和液态水的流动特征数据;液态水的流动特征数据包括液态水在催化层中的迁移与再分布的特征数据;

    第二确定模块403,被配置为执行基于液态水的流动特征数据,利用孔尺度模型,确定数值模型中气体的扩散率和带电物质的导电率;

    第三确定模块404,被配置为执行根据固相分布数据和基于局部饱和度的有效因子确定活化比表面积;

    第四确定模块405,被配置执行基于液态水在催化层中的迁移与再分布的特征数据、气体的扩散率、带电物质的导电率和活化比表面积,得到催化层的性能参数。

    可选的,扫描图像为通过聚焦离子束扫描电子显微镜对催化层进行采集得到的灰度图像;

    构建模块401,被配置为执行:

    确定催化层中各组分在灰度图像中对应的分布区域;

    基于各组分在灰度图像中对应的分布区域,在预设计算空间中,构建催化层的数值模型。

    可选的,还包括第五确定模块,被配置为执行:根据下述公式(1)确定有效因子:

    其中,β为有效因子;S表示局部饱和度,表征基于预设计算空间中每个局部计算空间的液态水含量;

    第三确定模块404,被配置为执行:

    根据固相分布数据和基于局部饱和度的有效因子,基于下述公式(2)确定活化比表面积:

    其中,aV表示活化比表面积;SPt和V均为固相分布数据,其中,SPt表示催化剂粒子被聚合物电解质所覆盖的面积,V表示碳载铂的体积。

    可选的,装置还包括:

    建立模块,被配置为执行建立包含催化层的单电池的三维宏观模型;

    第六确定模块,被配置为执行基于三维宏观模型和催化层的性能参数,确定单电池的性能曲线;性能曲线包括电池电压与电池平均电流密度的关系曲线。

    本申请实施例中的装置与方法实施例基于同样地申请构思。

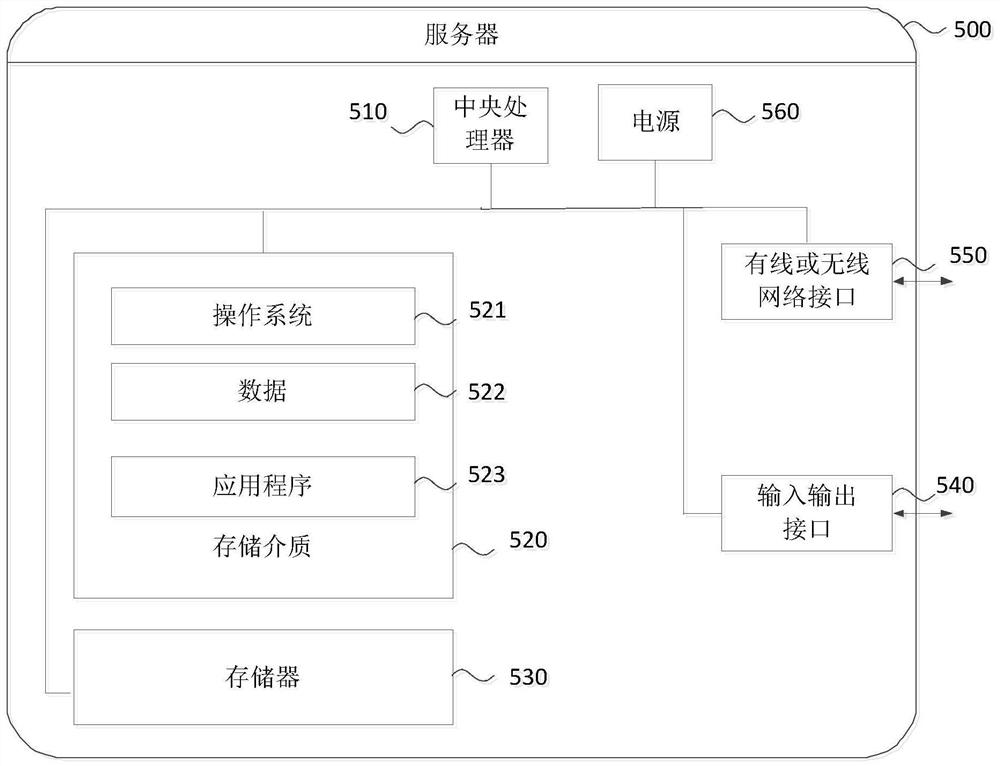
    本申请实施例所提供的方法实施例可以在计算机终端、服务器或者类似的运算装置中执行。以运行在服务器上为例,图5是本申请实施例提供的一种燃料电池催化层的性能分析方法的服务器的硬件结构框图。如图5所示,该服务器500可因配置或性能不同而产生比较大的差异,可以包括一个或一个以上中央处理器(Central Processing Units,CPU)510(处理器510可以包括但不限于微处理器NCU或可编程逻辑器件FPGA等的处理装置)、用于存储数据的存储器530,一个或一个以上存储应用程序523或数据522的存储介质520(例如一个或一个以上海量存储设备)。其中,存储器530和存储介质520可以是短暂存储或持久存储。存储在存储介质520的程序可以包括一个或一个以上模块,每个模块可以包括对服务器中的一系列指令操作。更进一步地,中央处理器510可以设置为与存储介质520通信,在服务器500上执行存储介质520中的一系列指令操作。服务器500还可以包括一个或一个以上电源560,一个或一个以上有线或无线网络接口550,一个或一个以上输入输出接口540,和/或,一个或一个以上操作系统521,例如Windows,Mac OS,Unix,Linux,FreeBSD等等。

    输入输出接口540可以用于经由一个网络接收或者发送数据。上述的网络具体实例可包括服务器500的通信供应商提供的无线网络。在一个实例中,输入输出接口540包括一个网络适配器(Network Interface Controller,NIC),其可通过基站与其他网络设备相连从而可与互联网进行通讯。在一个实例中,输入输出接口540可以为射频(RadioFrequency,RF)模块,其用于通过无线方式与互联网进行通讯。

    本领域普通技术人员可以理解,图5所示的结构仅为示意,其并不对上述电子装置的结构造成限定。例如,服务器500还可包括比图5中所示更多或者更少的组件,或者具有与图5所示不同的配置。

    本申请的实施例还提供了一种存储介质,所述存储介质可设置于服务器之中以保存用于实现方法实施例中一种燃料电池催化层的性能分析方法相关的至少一条指令、至少一段程序、代码集或指令集,该至少一条指令、该至少一段程序、该代码集或指令集由该处理器加载并执行以实现上述燃料电池催化层的性能分析方法。

    可选地,在本实施例中,上述存储介质可以位于计算机网络的多个网络服务器中的至少一个网络服务器。可选地,在本实施例中,上述存储介质可以包括但不限于:U盘、只读存储器(ROM,Read-Only Memory)、随机存取存储器(RAM,Random Access Memory)、移动硬盘、磁碟或者光盘等各种可以存储程序代码的介质。

    由上述本申请提供的燃料电池催化层的性能分析方法、装置、设备及存储介质的实施例可见,本申请中通过基于催化层的扫描图像构建催化层的数值模型;基于数值模型,利用格子玻尔兹曼方法模拟水动力行为,得到固相分布数据和液态水的流动特征数据;液态水的流动特征数据包括液态水在催化层中的迁移与再分布的特征数据;基于液态水的流动特征数据,利用孔尺度模型,确定数值模型中气体的扩散率和带电物质的导电率;根据固相分布数据和基于局部饱和度的有效因子确定活化比表面积;基于液态水在催化层中的迁移与再分布的特征数据、气体的扩散率、带电物质的导电率和活化比表面积,得到催化层的性能参数。本申请可以较为真实的去模拟不同水分布条件下的催化层的微观形态,通过引入有效因子来修正ECSA,以反映水淹对催化剂粒子活化所带来的负面影响,从而可以准确评估燃料电池催化层的性能状态。

    需要说明的是:上述本申请实施例先后顺序仅仅为了描述,不代表实施例的优劣。且上述对本说明书特定实施例进行了描述。其它实施例在所附权利要求书的范围内。在一些情况下,在权利要求书中记载的动作或步骤可以按照不同于实施例中的顺序来执行并且仍然可以实现期望的结果。另外,在附图中描绘的过程不一定要求示出的特定顺序或者连续顺序才能实现期望的结果。在某些实施方式中,多任务处理和并行处理也是可以的或者可能是有利的。

    本说明书中的各个实施例均采用递进的方式描述,各个实施例之间相同相似的部分互相参见即可,每个实施例重点说明的都是与其他实施例的不同之处。尤其,对于设备实施例而言,由于其基本相似于方法实施例,所以描述的比较简单,相关之处参见方法实施例的部分说明即可。

    本领域普通技术人员可以理解实现上述实施例的全部或部分步骤可以通过硬件来完成,也可以通过程序来指令相关的硬件完成,所述的程序可以存储于一种计算机可读存储介质中,上述提到的存储介质可以是只读存储器,磁盘或光盘等。

    以上所述仅为本申请的较佳实施例,并不用以限制本申请,凡在本申请的精神和原则之内,所作的任何修改、等同替换、改进等,均应包含在本申请的保护范围之内。

    燃料电池催化层的性能分析方法、装置、设备及存储介质

    Technical field

    The present application relates to the field of fuel cell technology, in particular to a performance analysis method, apparatus, apparatus and storage medium of a fuel cell catalytic layer.

    Background

    Protonexchange membrane fuel cell (PEMFC) is an efficient energy conversion device, which can directly convert the chemical energy stored in hydrogen fuel and oxidant into electrical energy through electrochemical reactions, with the characteristics of green environmental protection, high specific energy, low temperature fast start and high smooth operation.

    PEMFC consists of three main components: membrane electrode assemblies (Membrane ElectrodeAssemblies, MEA), cathode(Anode) porous electrodes, and collector bipolar plates (BipolarPate, BP). At the anodic catalytic layer, hydrogen diffuses to the surface of the membrane electrode through a porous electrode and undergoes an oxidation reaction of hydrogen (HOR) conversion into protons and electrons under the action of a platinum (Pt) catalyst. The electrochemically reactive membrane electrode assembly is at the heart of PEMFC, and the most commonly used type of polymer exchange membrane has a high Band Gap structure, making it an insulator of electrons. Therefore, electrons can only be transferred from the anode electrode to the cathode via an external circuit via a porous electrode and a bipolar manifold. At the cathodic catalytic layer, protons and electrons migrating through the polymer membrane and external circuits, respectively, and oxygen diffusion from the cathode runners are gathered together and oxygen reduction reaction (ORR) occurs. Water is the only by-product of the reaction, which will gradually move from the catalytic layer to the microporous layer and the gas diffusion layer, and finally leave through the gas flow channel in the manifold and be discharged by the car exhaust pipe, which can achieve the purpose of zero emission of automobile exhaust.

    Although PEMFC has superior operating performance and environmental friendliness, there are still many key technical issues that hinder its full commercialization, such as water management, thermal management, durability and efficient catalytic technology. The water management problems in PEMFC cover every component that makes up the battery: the Proton Exchange Membrane (PEM), the Catalyst Layer (CL), the Micro Porous Layer (MPL), the Gas Diffusion Layer (GDL), and the gas flow channel.

    The transport of water within fuel cells has a significant impact on system performance. In order to maintain high proton conductivity in PEMFC, the polymer membrane must maintain a certain amount of moisture content to avoid membrane drying up, but too much water will cause the catalytic layer, microporous layer, gas diffusion layer or gas channel "flooding" phenomenon, inhibit the transport of gas reactants to the reaction site, and inactivate some of the active sites, reducing the efficiency of the device.

    Therefore, proper water management is a key technology to improve the performance of PEMFC, especially for cathode components. However, in the current fuel cell simulation methods, there is no effective way to assess the effect of flooding on electrode performance.

    Contents of the Invention

    Embodiment of the present application provides a performance analysis method, apparatus, equipment and storage medium of the fuel cell catalytic layer, which can be more realistic to simulate the microscopic morphology of the catalytic layer under different water distribution conditions, and correct the ECSA by introducing effective factors to reflect the negative impact of flooding on the activation of catalyst particles, so as to accurately evaluate the performance state of the fuel cell catalytic layer.

    On the one hand, the present application embodiment provides a performance analysis method of the catalytic layer of a fuel cell, comprising:

    Construct a numerical model of the catalytic layer based on the scanned image of the catalytic layer;

    Based on the numerical model, the hydrodynamic behavior of lattice Boltzmann method is used to simulate the solid phase distribution data and the flow characteristic data of liquid water, and the flow characteristic data of liquid water include the characteristic data of liquid water migration and redistribution in the catalytic layer.

    Based on the flow characteristic data of liquid water, the diffusion rate of gases and the conductivity of charged substances in the numerical model are determined by using the pore scale model.

    The activation specific surface area is determined based on the solid-phase distribution data and the effective factor based on local saturation;

    Based on the characteristic data of the migration and redistribution of liquid water in the catalytic layer, the diffusion rate of the gas, the conductivity of the charged substance and the specific surface area of activation, the performance parameters of the catalytic layer are obtained.

    Optionally, the scanned image is a grayscale image acquired from the catalytic layer by a focused ion beam scanning electron microscope;

    Construct a numerical model of the catalytic layer based on the scanned image of the catalytic layer, including:

    Determine the distribution area of each component in the catalytic layer corresponding to the grayscale image;

    Based on the distribution area corresponding to each component in the grayscale image, a numerical model of the catalytic layer is constructed in the preset calculation space.

    Optionally, the effective factor is determined according to the following equation (1):

    where β is the effective factor; S represents local saturation, characterizing the liquid water content of each local computing space based on the preset calculation space;

    The activation specific surface area is determined based on solid-phase distribution data and effective factors based on local saturation, including:

    Based on the solid-phase distribution data and the effective factor based on local saturation, the activation specific surface area is determined based on the following formula (2):

    where aV represents the specific surface area of activation, SPt and V are solid-phase distribution data, where SPt represents the area covered by the polymer electrolyte of the catalyst particles and V represents the volume of carbon-loaded platinum.

    Optionally, the methods also include:

    Establish a three-dimensional macroscopic model of a single cell containing a catalytic layer;

    Based on the 3D macroscopic model and the performance parameters of the catalytic layer, the performance curve of a single battery is determined, and the performance curve includes the relationship curve between battery voltage and battery average current density.

    In another aspect, the present application embodiment provides a performance analysis apparatus for the catalytic layer of a fuel cell, comprising:

    Building blocks, configured to perform numerical models of the catalytic layer based on scanned images of the catalytic layer;

    The first determination module, configured to perform a numerical model based on the model, using the lattice Boltzmann method to simulate hydrodynamic behavior, to obtain solid phase distribution data and liquid water flow characteristic data; liquid water flow characteristic data include liquid water migration and redistribution characteristic data in the catalytic layer;

    The second determination module, which is configured to perform flow characteristic data based on liquid water, uses the pore scale model to determine the diffusion rate of the gas and the conductivity of the charged substance in the numerical model;

    The third determination module, configured to perform activation specific surface area determination based on solid-phase distribution data and effective factors based on local saturation;

    The fourth determination module, which is configured to perform the performance parameters of the catalytic layer based on the characteristic data of the migration and redistribution of liquid water in the catalytic layer, the diffusion rate of the gas, the conductivity of the charged substance and the specific surface area of activation.

    Optionally, the scanned image is a grayscale image acquired from the catalytic layer by a focused ion beam scanning electron microscope;

    The building blocks are configured to execute:

    Determine the distribution area of each component in the catalytic layer corresponding to the grayscale image;

    Based on the distribution area corresponding to each component in the grayscale image, a numerical model of the catalytic layer is constructed in the preset calculation space.

    Optionally, a fifth determination module is also included, which is configured to execute: determine the effective factor according to the following formula (1):

    where β is the effective factor; S represents local saturation, characterizing the liquid water content of each local computing space based on the preset calculation space;

    The third determination module, configured to execute:

    Based on the solid-phase distribution data and the effective factor based on local saturation, the activation specific surface area is determined based on the following formula (2):

    where aV represents the specific surface area of activation, SPt and V are solid-phase distribution data, where SPt represents the area covered by the polymer electrolyte of the catalyst particles and V represents the volume of carbon-loaded platinum.

    Optionally, the unit also includes:

    Build a module that is configured to perform a three-dimensional macroscopic model of a single cell containing a catalytic layer;

    The sixth determination module, which is configured to perform performance parameters based on the 3D macroscopic model and the catalytic layer, determines the performance curve of a single cell, which includes a curve between battery voltage and average battery current density.

    On the other hand, the present application embodiment provides an apparatus comprising a processor and a memory, the memory stores at least one instruction or at least one program, at least one instruction or at least one program loaded by the processor and performs the performance analysis method of the fuel cell catalytic layer.

    On the other hand, the present application embodiment provides a computer storage medium, the storage medium stores at least one instruction or at least one program, at least one instruction or at least one program loaded by the processor and executed to achieve the performance analysis method of the fuel cell catalytic layer described above.

    The performance analysis method, apparatus, equipment and storage medium of the fuel cell catalytic layer provided in the embodiment of the present application has the following beneficial effects:

    Based on the scanning image of the catalytic layer, a numerical model of the catalytic layer is constructed; based on the numerical model, the hydrodynamic behavior of the lattice Boltzmann method is used to obtain the solid-phase distribution data and the flow characteristic data of liquid water; the flow characteristic data of liquid water include the characteristic data of the migration and redistribution of liquid water in the catalytic layer; the flow characteristic data of liquid water are used to determine the diffusion rate of gases and the conductivity of charged substances in the numerical model by using the pore scale model The specific surface area of activation is determined based on the solid phase distribution data and the effective factor based on local saturation, and the performance parameters of the catalytic layer are obtained based on the characteristic data of the migration and redistribution of liquid water in the catalytic layer, the diffusion rate of the gas, the conductivity of the charged substance and the activation specific surface area. This application can realistically simulate the microscopic morphology of the catalytic layer under different water distribution conditions, and correct the ECSA by introducing an effective factor to reflect the negative impact of flooding on the activation of catalyst particles, so that the performance state of the catalytic layer of the fuel cell can be accurately evaluated.

    Illustrations

    In order to more clearly illustrate the technical solution in the embodiment of the present application, the following will be a brief introduction to the drawings to be used in the description of the embodiment, it is obvious that the drawings described below are only some embodiments of the present application, for those of ordinary skill in the art, without paying creative labor, other drawings can also be obtained according to these drawings.

    FIG 1 is a schematic diagram of a PEMFC single battery structure provided in the present application embodiment;

    FIG 2 is a schematic diagram of a performance analysis method of a fuel cell catalytic layer provided in the present application embodiment;

    FIG 3 is a schematic diagram of the performance analysis process of a fuel cell catalytic layer provided in the present application embodiment;

    FIG 4 is a schematic structural diagram of a performance analysis apparatus of a fuel cell catalytic layer provided in the present application embodiment;

    FIG 5 is a hardware block diagram of a fuel cell catalytic layer performance analysis method provided in the present application embodiment of the server.

    Specific embodiments

    The following will be combined with the drawings in the embodiment of the present application, the technical solution in the embodiment of the present application is clearly and completely described, it is clear that the embodiment described is only a part of the embodiment of the present application, not all embodiments. Based on the embodiments in the present application, all other embodiments obtained by those of ordinary skill in the art without performing creative labor, are within the scope of protection of the present application.

    It should be noted that the description and claims of the present application and the above-described drawings in the terms "first", "second", etc. are used to distinguish similar objects, and do not have to be used to describe a particular order or order. It should be understood that the data used in this way are interchangeable in appropriate circumstances, so that the embodiments of the present application described herein can be implemented in order other than those illustrated or described herein. Further, the terms "comprising" and "having" and any variation thereof is intended to cover an unequal inclusion, e.g., a process comprising a series of steps or units, methods, systems, products or services apparatus not necessarily limited to those steps or units clearly listed, but may include other steps or units that are not clearly listed or inherent to these processes, methods, products or devices.

    FIG 1 is a schematic diagram of a PEMFC single cell structure provided in the present application embodiment, comprising a proton exchange membrane, an anode / cathode catalytic layer, a gas diffusion layer, anode / cathode runner and a bipolar plate. Among them, the gas diffusion layer is mainly made of carbon fiber, which acts as a conductive electron. The catalytic layer consists of four main elements: spherical graphite, which acts as a transfer of electrons; ionic polymers, which act as conductive protons; platinum catalysts, which provide electrochemical reaction sites; and pores, which facilitate the transport of reactants and products (such as oxygen, water vapor, and liquid water) of the anode and cathode.

    Performance parameters directly related to fuel cell simulation experiments include permeability, porosity, conductivity, gas diffusion, and electrochemical active surface area (ECSA). For example, the catalytic layer needs to provide electron and proton transport pathways, accessibility of the reaction gas, high catalytic activity to HOR and ORR, and a sufficiently high ECSA. These parameters have corresponding special equipment and experimental methods that can be measured, but there are higher requirements for experimental equipment and site conditions. For the average researcher, it is difficult to have the corresponding experimental conditions and the cost is high. Therefore, it becomes meaningful to test the performance of the electrodes by means of simulation. It can assist in the conduct of fuel cell simulation experiments and improve the accuracy of simulation, so as to achieve a lot of time and money cost savings.

    In addition, in the current fuel cell macro simulation study, the performance parameters of the porous catalytic layer are determined by consulting the literature or artificial parameters, and the matching degree with the actual case is not high, which ignores the impact of the change of the porous electrode pore scale level on the electrode performance under different working conditions. This application simulates the microscopic morphology of the catalytic layer under different working conditions through simulation, and then evaluates the performance parameters of the catalytic layer under the conditions, so as to improve the accuracy of fuel cell performance simulation experiments.

    The following describes a specific embodiment of a performance analysis method of a fuel cell catalytic layer in the present application, FIG. 2 is a schematic diagram of a performance analysis method of a fuel cell catalytic layer provided in the present application embodiment, the present specification provides a method of operation such as an embodiment or flowchart, but based on conventional or uncompetitive labor may include more or less operating steps. The sequence of steps enumerated in an embodiment is only one of the many steps in the order of execution, does not represent a unique order of execution. Specifically, as shown in FIG. 2, the method may include:

    In step S201, a numerical model of the catalytic layer is constructed based on the scanned image of the catalytic layer.

    In the present embodiment, it is learned from experimental observations of hydrodynamic behavior in fuel cells that the kinetic behavior and transmission process of liquid water will have a significant impact on the performance and durability of each component of the PEMFC, especially for the cathodic catalytic layer. Therefore, understanding the two-phase transfer process in the various components of the PEMFC plays a crucial role in the water management and working performance of the battery.

    Since the basic microscale transmission phenomena that occur in PEMFC porous electrodes cannot be observed by traditional macroscopic flow simulations, porosity scale simulation techniques need to be used to describe them more accurately, so the microstructure of these porous media such as GDL, MPL and CL needs to be reconstructed. Correct characterization of the microstructure of the PEMFC catalytic layer is a prerequisite for a full understanding of the transport phenomenon.

    Thus, in the present embodiment, a high-precision focused ion beam scanning electron microscope (FIB-SEM) may be used to scan the catalytic layer sample, and then based on the scanned scanned image of the catalytic layer to construct a numerical model of the catalytic layer.

    In other embodiments of the present application, 2D images may also be progressively acquired by X-ray tomography, the acquired images are processed, and a numerical model of the catalytic layer is constructed; alternatively, a stochastic four-parameter growth method (QuartetStructure Gencration Set, QSGS) stochastic reconstruction of the numerical model of the catalytic layer may also be used.

    In an alternative embodiment, the scanning image is a grayscale image acquired by a focused ion beam scanning electron microscope of the catalytic layer; then, the above step S201 may include the following steps:

    Determine the distribution area of each component in the catalytic layer corresponding to the grayscale image;

    Based on the distribution area corresponding to each component in the grayscale image, a numerical model of the catalytic layer is constructed in the preset calculation space.

    Specifically, the original grayscale image of the catalytic layer is processed and converted into an 8-bit image, and then the grayscale image is pixel segmented to distinguish the components in the catalytic layer: pores, carbon carriers, adhesives and the distribution area of the platinum catalyst, the gray pixel values corresponding to different components are different, wherein the gray pixel values corresponding to the carbon support are 70 to 100, the gray pixel values corresponding to the adhesive are 155, the gray pixel values corresponding to platinum are 255, and the gray pixel values corresponding to the pores are 0. Referring to FIG. 3, (a) is a schematic diagram of a grayscale image of a catalytic layer provided in the present embodiment of the application, (b) is a schematic diagram of a numerical model of a catalytic layer provided in the embodiment of the present application, the numerical model characterizes the geometry of the real catalytic layer, wherein the numerical model corresponds to the size of the preset calculation space of 200×200×200, and the reconstructed catalytic layer geometry has only two solid phases (carbon carrier and Pt) in the computing domain.

    In step S203, based on the numerical model, the hydrodynamic behavior of lattice Boltzmann method is used to simulate the solid phase distribution data and the flow characteristic data of liquid water; the flow characteristic data of liquid water include the characteristic data of liquid water migration and redistribution in the catalytic layer.

    The lattice Boltzmann method (LBM) is a mesoscopic simulation method that links macroscopic and microscopic models.

    In the embodiment of the present application, the method is used to study the two-phase flow problem in the catalytic layer, simulating the hydrodynamic behavior in the catalytic layer, as shown in (c) in FIG. 3; thus, it is possible to obtain solid phase distribution data under different working conditions and liquid water flow characteristic data, different working conditions refers to different conditions of water distribution, different conditions of water content in the catalytic layer is different; liquid water flow characteristic data include liquid water in the catalytic layer migration and redistribution characteristic data.

    In step S205, based on the flow characteristic data of liquid water, the diffusion rate of the gas and the conductivity of the charged substance in the numerical model are determined by using the pore scale model.

    In the present embodiment, based on the flow characteristic data of liquid water, combined with pore scale model (pore scalemodel, PSM) to determine the content of different water and its distribution form, the diffusion rate of the gas and the conductivity of the charged substance in the numerical model.

    In step S207, the activation specific surface area is determined based on the solid phase distribution data and the effective factor based on local saturation.

    Among them, the activation specific surface area (ECSA) refers to the electrochemically active surface area, that is, the effective area involved in the electrochemical reaction. ECSA is usually based on solid-phase distribution data in the output of LBM, ecSA is defined as the ratio of the surface area of platinum particles covered by water to the volume of carbon-loaded platinum.

    In the present embodiment of the application, it has been verified that the degree of contact between water and catalyst particles determines the size of ecsa, i.e., the water content and its distribution form will affect ECSA. Therefore, the present application introduces an effective factor to correct the ECSA when determining the ECSA to reflect the negative impact of flooding on the activation of catalyst particles.

    In an alternative embodiment, the effective factor is determined according to the following formula (1):

    where β is the effective factor; S represents local saturation, characterizing the liquid water content of each local computing space based on the preset computing space; for example, the preset computing space is divided into 8×8×8 local computing spaces, and the size of each local computing space is 25×25×25.

    Correspondingly, the above steps S207 may include:

    Based on the solid-phase distribution data and the effective factor based on local saturation, the activation specific surface area is determined based on the following formula (2):

    where aV represents the specific surface area of activation, SPt and V are solid-phase distribution data, where SPt represents the area covered by the polymer electrolyte of the catalyst particles and V represents the volume of carbon-loaded platinum.

    In step S209, based on the characteristic data of the migration and redistribution of liquid water in the catalytic layer, the diffusion rate of the gas, the conductivity of the charged substance and the specific surface area of activation, the performance parameters of the catalytic layer are obtained.

    In the embodiment of the present application, the characteristic data of the migration and redistribution of liquid water in the catalytic layer, the diffusion rate of the gas, the conductivity of the charged substance and the specific surface area of activation, can be characterized as the performance parameters of the catalytic layer.

    Further, the performance parameters of the above catalytic layer can be integrated and combined with the single-cell macro model to further determine the performance of the single battery. Among an alternative embodiment, the present application method further comprises:

    Establish a three-dimensional macroscopic model of a single cell containing a catalytic layer;

    Based on the 3D macroscopic model and the performance parameters of the catalytic layer, the performance curve of a single battery is determined, and the performance curve includes the relationship curve between battery voltage and battery average current density.

    Among them, the relationship curve between battery voltage and battery average current density is used to characterize the performance of a single battery.

    Specifically, the three-dimensional macroscopic model, as shown in (d) in Figure 3, consists of a membrane electrode assembly and an anode/cathode gas channels. After obtaining the performance parameters of the cathodic catalytic layer (diffusion rate of gas, conductivity of charged substances and specific surface area of activation), it is combined with the macroscopic model of single battery to further determine the performance of single battery. In this way, the time and money cost of the experiment can be greatly reduced, and the accuracy of the single-battery simulation experiment can be effectively improved.

    In summary, after the three-dimensional numerical model of the catalytic layer is reconstructed based on the scanning image of the catalytic layer in the present application embodiment, the two-phase flow problem in the geometric morphology of the catalytic layer is studied by lattice Boltzmann method, the hydrodynamic behavior is simulated, and the solid phase distribution data and the flow characteristic data of liquid water are obtained, and secondly, the diffusion rate of the gas and the conductivity of the charged substance in the numerical model are determined by the pore scale model, and the ECSA is corrected by the effective factor to reflect the negative impact of flooding on the activation of catalyst particles. In this way, the catalytic capacity of the porous electrode can be more accurately characterized, and the performance parameters of the final catalytic layer can be combined with the three-dimensional macroscopic model of the single battery to further analyze the performance of the single battery, which can improve the accuracy of the fuel cell performance simulation experiment.

    Embodiment of the present application further provides a performance analysis apparatus of a fuel cell catalytic layer, FIG. 4 is a structural schematic diagram of a performance analysis apparatus of a fuel cell catalytic layer provided in the embodiment of the present application, as shown in FIG. 4, the apparatus comprising:

    Building block 401, configured to perform a numerical model of the catalytic layer based on the scanning image of the catalytic layer to construct;

    The first determination module 402, configured to perform based on a numerical model, using the lattice Boltzmann method to simulate hydrodynamic behavior, to obtain solid phase distribution data and liquid water flow characteristic data; liquid water flow characteristic data include liquid water migration and redistribution characteristic data in the catalytic layer;

    The second determination module 403, configured to perform flow characteristic data based on liquid water, using a pore-scale model, to determine the diffusion rate of the gas and the conductivity of the charged substance in the numerical model;

    The third determination module 404, configured to perform the determination of the activation specific surface area based on the solid phase distribution data and the effective factor based on local saturation;

    The fourth determination module 405, is configured to perform based on the characteristic data of liquid water migration and redistribution in the catalytic layer, the diffusion rate of the gas, the conductivity of the charged substance and the specific surface area of activation, to obtain the performance parameters of the catalytic layer.

    Optionally, the scanned image is a grayscale image acquired from the catalytic layer by a focused ion beam scanning electron microscope;

    Building block 401, configured to execute:

    Determine the distribution area of each component in the catalytic layer corresponding to the grayscale image;

    Based on the distribution area corresponding to each component in the grayscale image, a numerical model of the catalytic layer is constructed in the preset calculation space.

    Optionally, a fifth determination module is also included, which is configured to execute: determine the effective factor according to the following formula (1):

    where β is the effective factor; S represents local saturation, characterizing the liquid water content of each local computing space based on the preset calculation space;

    The third determining module 404, configured to execute:

    Based on the solid-phase distribution data and the effective factor based on local saturation, the activation specific surface area is determined based on the following formula (2):

    where aV represents the specific surface area of activation, SPt and V are solid-phase distribution data, where SPt represents the area covered by the polymer electrolyte of the catalyst particles and V represents the volume of carbon-loaded platinum.

    Optionally, the unit also includes:

    Build a module that is configured to perform a three-dimensional macroscopic model of a single cell containing a catalytic layer;

    The sixth determination module, which is configured to perform performance parameters based on the 3D macroscopic model and the catalytic layer, determines the performance curve of a single cell, which includes a curve between battery voltage and average battery current density.

    Embodiments of the apparatus and method embodiments in the present application are based on the same application idea.

    Embodiments of the methods provided in the present application embodiment may be performed in a computer terminal, server, or similar computing device. Taking the server running as an example, FIG. 5 is a hardware block diagram of a fuel cell catalytic layer performance analysis method provided in the present application embodiment of the server. As shown in FIG. 5, the server 500 may produce relatively large differences due to different configurations or performance, may include one or more central processing units (Central Processing Units, CPU) 510 (processor 510 may include, but is not limited to, microprocessor NCU or programmable logic device FPGA and the like processing device), memory for storing data 530, one or more storage applications 523 or data storage medium 520 ( For example, one or one storage device in the amount of Shanghai). Wherein, the memory 530 and the storage medium 520 may be transient storage or persistent storage. The program stored in the storage medium 520 may include one or more modules, each module may include a series of instructions to the server operation. Further, the central processor 510 may be configured to communicate with the storage medium 520, performing a series of instruction operations in the storage medium 520 on the server 500. Server 500 may further include one or more power supplies 560, one or more wired or wireless network interfaces 550, one or more input and output interfaces 540, and / or, one or more operating systems 521, such as Windows, Mac OS, Unix, Linux, FreeBSD and the like.

    Input and output interface 540 may be used to receive or transmit data via a network. Specific examples of the above networks may include a wireless network provided by the communication provider of the server 500. In one example, the input and output interface 540 includes a network adapter (Network Interface Controller, NIC), which may be connected to other network devices through the base station to communicate with the Internet. In one example, the input and output interface 540 may be a radio frequency (RadioFrequency, RF) module for communicating with the Internet by wireless means.

    Those of ordinary skill in the art will appreciate that the structure shown in FIG. 5 is only illustrative, which does not qualify the structure of the above-described electronic device. For example, the server 500 may further comprise more or fewer components than shown in FIG. 5, or having a different configuration than shown in FIG. 5.

    Embodiments of the present application further provide a storage medium, the storage medium may be disposed in the server to save a method embodiment of a fuel cell catalytic layer performance analysis method related to at least one instruction, at least one program, code set or instruction set, the at least one instruction, the at least one program, the code set or instruction set by the processor loaded and executed to achieve the performance analysis method of the fuel cell catalytic layer.

    Alternatively, in the present embodiment, the storage medium may be located in at least one of the plurality of network servers on the computer network. Alternatively, in the present embodiment, the above-described storage medium may include, but is not limited to: a U disk, read-only memory (ROM, Read-Only Memory), random access memory (RAM, Random Access Memory), a removable hard disk, a magnetic disk or a disc and the like may store program code and other media.

    Embodiments of the performance analysis method, apparatus, apparatus and storage medium of the fuel cell catalytic layer provided by the above application can be seen, the present application constructs a numerical model of the catalytic layer by scanning the image based on the catalytic layer; based on the numerical model, the hydrodynamic behavior of the lattice Boltzmann method is used to simulate the hydrodynamic behavior, and the solid phase distribution data and the flow characteristic data of liquid water are obtained; the flow characteristic data of liquid water include the characteristic data of the migration and redistribution of liquid water in the catalytic layer; the flow characteristic data based on liquid water, using a pore scale model The specific surface area of activation is determined according to the solid phase distribution data and the effective factor based on local saturation, and the performance parameters of the catalytic layer are obtained based on the characteristic data of the migration and redistribution of liquid water in the catalytic layer, the diffusion rate of the gas, the conductivity of the charged substance and the specific surface area of activation. This application can realistically simulate the microscopic morphology of the catalytic layer under different water distribution conditions, and correct the ECSA by introducing an effective factor to reflect the negative impact of flooding on the activation of catalyst particles, so that the performance state of the catalytic layer of the fuel cell can be accurately evaluated.

    It should be noted that the above-mentioned sequence of embodiments of the present application is only for description and does not represent the advantages and disadvantages of the embodiments. And the above specific embodiments of the present specification are described. Other embodiments are within the scope of the appended claims. In some cases, the actions or steps recorded in the claims may be performed in a different order than in the embodiments and still the desired result may be achieved. Further, the process depicted in the drawings does not necessarily require a particular order shown or a continuous sequence to achieve the desired result. In certain embodiments, multitasking and parallel processing may also be or may be advantageous.

    Each embodiment in the present specification is described in a progressive manner, the same similar parts between each embodiment can be seen with each other, each embodiment focuses on the differences with other embodiments. In particular, for the device embodiment, because it is substantially similar to the method embodiment, the description is relatively simple, and the relevant points can be described in part of the method embodiment.

    Those of ordinary skill in the art will appreciate that all or part of the steps to implement the above embodiments may be completed by hardware, or may be completed by programs to instruct related hardware, the program may be stored in a computer-readable storage medium, the storage medium referred to above may be read-only memory, disk or optical disk and the like.

    The foregoing is only a preferred embodiment of the present application and is not intended to limit the present application, and any modifications, equivalent substitutions, improvements, etc. made within the spirit and principles of this application shall be included in the scope of protection of this application.

    Performance analysis method and device for catalyst layer of fuel cell, equipment and storage medium

    Technical field

    The present application relates to the field of fuel cell technology, in particular to a performance analysis method, apparatus, apparatus and storage medium of a fuel cell catalytic layer.

    Background

    Protonexchange membrane fuel cell (PEMFC) is an efficient energy conversion device, which can directly convert the chemical energy stored in hydrogen fuel and oxidant into electrical energy through electrochemical reactions, with the characteristics of green environmental protection, high specific energy, low temperature fast start and high smooth operation.

    PEMFC consists of three main components: membrane electrode assemblies (Membrane ElectrodeAssemblies, MEA), cathode(Anode) porous electrodes, and collector bipolar plates (BipolarPate, BP). At the anodic catalytic layer, hydrogen diffuses to the surface of the membrane electrode through a porous electrode and undergoes an oxidation reaction of hydrogen (HOR) conversion into protons and electrons under the action of a platinum (Pt) catalyst. The electrochemically reactive membrane electrode assembly is at the heart of PEMFC, and the most commonly used type of polymer exchange membrane has a high Band Gap structure, making it an insulator of electrons. Therefore, electrons can only be transferred from the anode electrode to the cathode via an external circuit via a porous electrode and a bipolar manifold. At the cathodic catalytic layer, protons and electrons migrating through the polymer membrane and external circuits, respectively, and oxygen diffusion from the cathode runners are gathered together and oxygen reduction reaction (ORR) occurs. Water is the only by-product of the reaction, which will gradually move from the catalytic layer to the microporous layer and the gas diffusion layer, and finally leave through the gas flow channel in the manifold and be discharged by the car exhaust pipe, which can achieve the purpose of zero emission of automobile exhaust.

    Although PEMFC has superior operating performance and environmental friendliness, there are still many key technical issues that hinder its full commercialization, such as water management, thermal management, durability and efficient catalytic technology. The water management problems in PEMFC cover every component that makes up the battery: the Proton Exchange Membrane (PEM), the Catalyst Layer (CL), the Micro Porous Layer (MPL), the Gas Diffusion Layer (GDL), and the gas flow channel.

    The transport of water within fuel cells has a significant impact on system performance. In order to maintain high proton conductivity in PEMFC, the polymer membrane must maintain a certain amount of moisture content to avoid membrane drying up, but too much water will cause the catalytic layer, microporous layer, gas diffusion layer or gas channel "flooding" phenomenon, inhibit the transport of gas reactants to the reaction site, and inactivate some of the active sites, reducing the efficiency of the device.

    Therefore, proper water management is a key technology to improve the performance of PEMFC, especially for cathode components. However, in the current fuel cell simulation methods, there is no effective way to assess the effect of flooding on electrode performance.

    Contents of the Invention

    Embodiment of the present application provides a performance analysis method, apparatus, equipment and storage medium of the fuel cell catalytic layer, which can be more realistic to simulate the microscopic morphology of the catalytic layer under different water distribution conditions, and correct the ECSA by introducing effective factors to reflect the negative impact of flooding on the activation of catalyst particles, so as to accurately evaluate the performance state of the fuel cell catalytic layer.

    On the one hand, the present application embodiment provides a performance analysis method of the catalytic layer of a fuel cell, comprising:

    Construct a numerical model of the catalytic layer based on the scanned image of the catalytic layer;

    Based on the numerical model, the hydrodynamic behavior of lattice Boltzmann method is used to simulate the solid phase distribution data and the flow characteristic data of liquid water, and the flow characteristic data of liquid water include the characteristic data of liquid water migration and redistribution in the catalytic layer.

    Based on the flow characteristic data of liquid water, the diffusion rate of gases and the conductivity of charged substances in the numerical model are determined by using the pore scale model.

    The activation specific surface area is determined based on the solid-phase distribution data and the effective factor based on local saturation;

    Based on the characteristic data of the migration and redistribution of liquid water in the catalytic layer, the diffusion rate of the gas, the conductivity of the charged substance and the specific surface area of activation, the performance parameters of the catalytic layer are obtained.

    Optionally, the scanned image is a grayscale image acquired from the catalytic layer by a focused ion beam scanning electron microscope;

    Construct a numerical model of the catalytic layer based on the scanned image of the catalytic layer, including:

    Determine the distribution area of each component in the catalytic layer corresponding to the grayscale image;

    Based on the distribution area corresponding to each component in the grayscale image, a numerical model of the catalytic layer is constructed in the preset calculation space.

    Optionally, the effective factor is determined according to the following equation (1):

    where β is the effective factor; S represents local saturation, characterizing the liquid water content of each local computing space based on the preset calculation space;

    The activation specific surface area is determined based on solid-phase distribution data and effective factors based on local saturation, including:

    Based on the solid-phase distribution data and the effective factor based on local saturation, the activation specific surface area is determined based on the following formula (2):

    where aV represents the specific surface area of activation, SPt and V are solid-phase distribution data, where SPt represents the area covered by the polymer electrolyte of the catalyst particles and V represents the volume of carbon-loaded platinum.

    Optionally, the methods also include:

    Establish a three-dimensional macroscopic model of a single cell containing a catalytic layer;

    Based on the 3D macroscopic model and the performance parameters of the catalytic layer, the performance curve of a single battery is determined, and the performance curve includes the relationship curve between battery voltage and battery average current density.

    In another aspect, the present application embodiment provides a performance analysis apparatus for the catalytic layer of a fuel cell, comprising:

    Building blocks, configured to perform numerical models of the catalytic layer based on scanned images of the catalytic layer;

    The first determination module, configured to perform a numerical model based on the model, using the lattice Boltzmann method to simulate hydrodynamic behavior, to obtain solid phase distribution data and liquid water flow characteristic data; liquid water flow characteristic data include liquid water migration and redistribution characteristic data in the catalytic layer;

    The second determination module, which is configured to perform flow characteristic data based on liquid water, uses the pore scale model to determine the diffusion rate of the gas and the conductivity of the charged substance in the numerical model;

    The third determination module, configured to perform activation specific surface area determination based on solid-phase distribution data and effective factors based on local saturation;

    The fourth determination module, which is configured to perform the performance parameters of the catalytic layer based on the characteristic data of the migration and redistribution of liquid water in the catalytic layer, the diffusion rate of the gas, the conductivity of the charged substance and the specific surface area of activation.

    Optionally, the scanned image is a grayscale image acquired from the catalytic layer by a focused ion beam scanning electron microscope;

    The building blocks are configured to execute:

    Determine the distribution area of each component in the catalytic layer corresponding to the grayscale image;

    Based on the distribution area corresponding to each component in the grayscale image, a numerical model of the catalytic layer is constructed in the preset calculation space.

    Optionally, a fifth determination module is also included, which is configured to execute: determine the effective factor according to the following formula (1):

    where β is the effective factor; S represents local saturation, characterizing the liquid water content of each local computing space based on the preset calculation space;

    The third determination module, configured to execute:

    Based on the solid-phase distribution data and the effective factor based on local saturation, the activation specific surface area is determined based on the following formula (2):

    where aV represents the specific surface area of activation, SPt and V are solid-phase distribution data, where SPt represents the area covered by the polymer electrolyte of the catalyst particles and V represents the volume of carbon-loaded platinum.

    Optionally, the unit also includes:

    Build a module that is configured to perform a three-dimensional macroscopic model of a single cell containing a catalytic layer;

    The sixth determination module, which is configured to perform performance parameters based on the 3D macroscopic model and the catalytic layer, determines the performance curve of a single cell, which includes a curve between battery voltage and average battery current density.

    On the other hand, the present application embodiment provides an apparatus comprising a processor and a memory, the memory stores at least one instruction or at least one program, at least one instruction or at least one program loaded by the processor and performs the performance analysis method of the fuel cell catalytic layer.

    On the other hand, the present application embodiment provides a computer storage medium, the storage medium stores at least one instruction or at least one program, at least one instruction or at least one program loaded by the processor and executed to achieve the performance analysis method of the fuel cell catalytic layer described above.

    The performance analysis method, apparatus, equipment and storage medium of the fuel cell catalytic layer provided in the embodiment of the present application has the following beneficial effects:

    Based on the scanning image of the catalytic layer, a numerical model of the catalytic layer is constructed; based on the numerical model, the hydrodynamic behavior of the lattice Boltzmann method is used to obtain the solid-phase distribution data and the flow characteristic data of liquid water; the flow characteristic data of liquid water include the characteristic data of the migration and redistribution of liquid water in the catalytic layer; the flow characteristic data of liquid water are used to determine the diffusion rate of gases and the conductivity of charged substances in the numerical model by using the pore scale model The specific surface area of activation is determined based on the solid phase distribution data and the effective factor based on local saturation, and the performance parameters of the catalytic layer are obtained based on the characteristic data of the migration and redistribution of liquid water in the catalytic layer, the diffusion rate of the gas, the conductivity of the charged substance and the activation specific surface area. This application can realistically simulate the microscopic morphology of the catalytic layer under different water distribution conditions, and correct the ECSA by introducing an effective factor to reflect the negative impact of flooding on the activation of catalyst particles, so that the performance state of the catalytic layer of the fuel cell can be accurately evaluated.

    Illustrations

    In order to more clearly illustrate the technical solution in the embodiment of the present application, the following will be a brief introduction to the drawings to be used in the description of the embodiment, it is obvious that the drawings described below are only some embodiments of the present application, for those of ordinary skill in the art, without paying creative labor, other drawings can also be obtained according to these drawings.

    FIG 1 is a schematic diagram of a PEMFC single battery structure provided in the present application embodiment;

    FIG 2 is a schematic diagram of a performance analysis method of a fuel cell catalytic layer provided in the present application embodiment;

    FIG 3 is a schematic diagram of the performance analysis process of a fuel cell catalytic layer provided in the present application embodiment;

    FIG 4 is a schematic structural diagram of a performance analysis apparatus of a fuel cell catalytic layer provided in the present application embodiment;

    FIG 5 is a hardware block diagram of a fuel cell catalytic layer performance analysis method provided in the present application embodiment of the server.

    Specific embodiments

    The following will be combined with the drawings in the embodiment of the present application, the technical solution in the embodiment of the present application is clearly and completely described, it is clear that the embodiment described is only a part of the embodiment of the present application, not all embodiments. Based on the embodiments in the present application, all other embodiments obtained by those of ordinary skill in the art without performing creative labor, are within the scope of protection of the present application.

    It should be noted that the description and claims of the present application and the above-described drawings in the terms "first", "second", etc. are used to distinguish similar objects, and do not have to be used to describe a particular order or order. It should be understood that the data used in this way are interchangeable in appropriate circumstances, so that the embodiments of the present application described herein can be implemented in order other than those illustrated or described herein. Further, the terms "comprising" and "having" and any variation thereof is intended to cover an unequal inclusion, e.g., a process comprising a series of steps or units, methods, systems, products or services apparatus not necessarily limited to those steps or units clearly listed, but may include other steps or units that are not clearly listed or inherent to these processes, methods, products or devices.

    FIG 1 is a schematic diagram of a PEMFC single cell structure provided in the present application embodiment, comprising a proton exchange membrane, an anode / cathode catalytic layer, a gas diffusion layer, anode / cathode runner and a bipolar plate. Among them, the gas diffusion layer is mainly made of carbon fiber, which acts as a conductive electron. The catalytic layer consists of four main elements: spherical graphite, which acts as a transfer of electrons; ionic polymers, which act as conductive protons; platinum catalysts, which provide electrochemical reaction sites; and pores, which facilitate the transport of reactants and products (such as oxygen, water vapor, and liquid water) of the anode and cathode.

    Performance parameters directly related to fuel cell simulation experiments include permeability, porosity, conductivity, gas diffusion, and electrochemical active surface area (ECSA). For example, the catalytic layer needs to provide electron and proton transport pathways, accessibility of the reaction gas, high catalytic activity to HOR and ORR, and a sufficiently high ECSA. These parameters have corresponding special equipment and experimental methods that can be measured, but there are higher requirements for experimental equipment and site conditions. For the average researcher, it is difficult to have the corresponding experimental conditions and the cost is high. Therefore, it becomes meaningful to test the performance of the electrodes by means of simulation. It can assist in the conduct of fuel cell simulation experiments and improve the accuracy of simulation, so as to achieve a lot of time and money cost savings.

    In addition, in the current fuel cell macro simulation study, the performance parameters of the porous catalytic layer are determined by consulting the literature or artificial parameters, and the matching degree with the actual case is not high, which ignores the impact of the change of the porous electrode pore scale level on the electrode performance under different working conditions. This application simulates the microscopic morphology of the catalytic layer under different working conditions through simulation, and then evaluates the performance parameters of the catalytic layer under the conditions, so as to improve the accuracy of fuel cell performance simulation experiments.

    The following describes a specific embodiment of a performance analysis method of a fuel cell catalytic layer in the present application, FIG. 2 is a schematic diagram of a performance analysis method of a fuel cell catalytic layer provided in the present application embodiment, the present specification provides a method of operation such as an embodiment or flowchart, but based on conventional or uncompetitive labor may include more or less operating steps. The sequence of steps enumerated in an embodiment is only one of the many steps in the order of execution, does not represent a unique order of execution. Specifically, as shown in FIG. 2, the method may include:

    In step S201, a numerical model of the catalytic layer is constructed based on the scanned image of the catalytic layer.

    In the present embodiment, it is learned from experimental observations of hydrodynamic behavior in fuel cells that the kinetic behavior and transmission process of liquid water will have a significant impact on the performance and durability of each component of the PEMFC, especially for the cathodic catalytic layer. Therefore, understanding the two-phase transfer process in the various components of the PEMFC plays a crucial role in the water management and working performance of the battery.

    Since the basic microscale transmission phenomena that occur in PEMFC porous electrodes cannot be observed by traditional macroscopic flow simulations, porosity scale simulation techniques need to be used to describe them more accurately, so the microstructure of these porous media such as GDL, MPL and CL needs to be reconstructed. Correct characterization of the microstructure of the PEMFC catalytic layer is a prerequisite for a full understanding of the transport phenomenon.

    Thus, in the present embodiment, a high-precision focused ion beam scanning electron microscope (FIB-SEM) may be used to scan the catalytic layer sample, and then based on the scanned scanned image of the catalytic layer to construct a numerical model of the catalytic layer.

    In other embodiments of the present application, 2D images may also be progressively acquired by X-ray tomography, the acquired images are processed, and a numerical model of the catalytic layer is constructed; alternatively, a stochastic four-parameter growth method (QuartetStructure Gencration Set, QSGS) stochastic reconstruction of the numerical model of the catalytic layer may also be used.

    In an alternative embodiment, the scanning image is a grayscale image acquired by a focused ion beam scanning electron microscope of the catalytic layer; then, the above step S201 may include the following steps:

    Determine the distribution area of each component in the catalytic layer corresponding to the grayscale image;

    Based on the distribution area corresponding to each component in the grayscale image, a numerical model of the catalytic layer is constructed in the preset calculation space.

    Specifically, the original grayscale image of the catalytic layer is processed and converted into an 8-bit image, and then the grayscale image is pixel segmented to distinguish the components in the catalytic layer: pores, carbon carriers, adhesives and the distribution area of the platinum catalyst, the gray pixel values corresponding to different components are different, wherein the gray pixel values corresponding to the carbon support are 70 to 100, the gray pixel values corresponding to the adhesive are 155, the gray pixel values corresponding to platinum are 255, and the gray pixel values corresponding to the pores are 0. Referring to FIG. 3, (a) is a schematic diagram of a grayscale image of a catalytic layer provided in the present embodiment of the application, (b) is a schematic diagram of a numerical model of a catalytic layer provided in the embodiment of the present application, the numerical model characterizes the geometry of the real catalytic layer, wherein the numerical model corresponds to the size of the preset calculation space of 200×200×200, and the reconstructed catalytic layer geometry has only two solid phases (carbon carrier and Pt) in the computing domain.

    In step S203, based on the numerical model, the hydrodynamic behavior of lattice Boltzmann method is used to simulate the solid phase distribution data and the flow characteristic data of liquid water; the flow characteristic data of liquid water include the characteristic data of liquid water migration and redistribution in the catalytic layer.

    The lattice Boltzmann method (LBM) is a mesoscopic simulation method that links macroscopic and microscopic models.

    In the embodiment of the present application, the method is used to study the two-phase flow problem in the catalytic layer, simulating the hydrodynamic behavior in the catalytic layer, as shown in (c) in FIG. 3; thus, it is possible to obtain solid phase distribution data under different working conditions and liquid water flow characteristic data, different working conditions refers to different conditions of water distribution, different conditions of water content in the catalytic layer is different; liquid water flow characteristic data include liquid water in the catalytic layer migration and redistribution characteristic data.

    In step S205, based on the flow characteristic data of liquid water, the diffusion rate of the gas and the conductivity of the charged substance in the numerical model are determined by using the pore scale model.

    In the present embodiment, based on the flow characteristic data of liquid water, combined with pore scale model (pore scalemodel, PSM) to determine the content of different water and its distribution form, the diffusion rate of the gas and the conductivity of the charged substance in the numerical model.

    In step S207, the activation specific surface area is determined based on the solid phase distribution data and the effective factor based on local saturation.

    Among them, the activation specific surface area (ECSA) refers to the electrochemically active surface area, that is, the effective area involved in the electrochemical reaction. ECSA is usually based on solid-phase distribution data in the output of LBM, ecSA is defined as the ratio of the surface area of platinum particles covered by water to the volume of carbon-loaded platinum.

    In the present embodiment of the application, it has been verified that the degree of contact between water and catalyst particles determines the size of ecsa, i.e., the water content and its distribution form will affect ECSA. Therefore, the present application introduces an effective factor to correct the ECSA when determining the ECSA to reflect the negative impact of flooding on the activation of catalyst particles.

    In an alternative embodiment, the effective factor is determined according to the following formula (1):

    where β is the effective factor; S represents local saturation, characterizing the liquid water content of each local computing space based on the preset computing space; for example, the preset computing space is divided into 8×8×8 local computing spaces, and the size of each local computing space is 25×25×25.

    Correspondingly, the above steps S207 may include:

    Based on the solid-phase distribution data and the effective factor based on local saturation, the activation specific surface area is determined based on the following formula (2):

    where aV represents the specific surface area of activation, SPt and V are solid-phase distribution data, where SPt represents the area covered by the polymer electrolyte of the catalyst particles and V represents the volume of carbon-loaded platinum.

    In step S209, based on the characteristic data of the migration and redistribution of liquid water in the catalytic layer, the diffusion rate of the gas, the conductivity of the charged substance and the specific surface area of activation, the performance parameters of the catalytic layer are obtained.

    In the embodiment of the present application, the characteristic data of the migration and redistribution of liquid water in the catalytic layer, the diffusion rate of the gas, the conductivity of the charged substance and the specific surface area of activation, can be characterized as the performance parameters of the catalytic layer.

    Further, the performance parameters of the above catalytic layer can be integrated and combined with the single-cell macro model to further determine the performance of the single battery. Among an alternative embodiment, the present application method further comprises:

    Establish a three-dimensional macroscopic model of a single cell containing a catalytic layer;

    Based on the 3D macroscopic model and the performance parameters of the catalytic layer, the performance curve of a single battery is determined, and the performance curve includes the relationship curve between battery voltage and battery average current density.

    Among them, the relationship curve between battery voltage and battery average current density is used to characterize the performance of a single battery.

    Specifically, the three-dimensional macroscopic model, as shown in (d) in Figure 3, consists of a membrane electrode assembly and an anode/cathode gas channels. After obtaining the performance parameters of the cathodic catalytic layer (diffusion rate of gas, conductivity of charged substances and specific surface area of activation), it is combined with the macroscopic model of single battery to further determine the performance of single battery. In this way, the time and money cost of the experiment can be greatly reduced, and the accuracy of the single-battery simulation experiment can be effectively improved.

    In summary, after the three-dimensional numerical model of the catalytic layer is reconstructed based on the scanning image of the catalytic layer in the present application embodiment, the two-phase flow problem in the geometric morphology of the catalytic layer is studied by lattice Boltzmann method, the hydrodynamic behavior is simulated, and the solid phase distribution data and the flow characteristic data of liquid water are obtained, and secondly, the diffusion rate of the gas and the conductivity of the charged substance in the numerical model are determined by the pore scale model, and the ECSA is corrected by the effective factor to reflect the negative impact of flooding on the activation of catalyst particles. In this way, the catalytic capacity of the porous electrode can be more accurately characterized, and the performance parameters of the final catalytic layer can be combined with the three-dimensional macroscopic model of the single battery to further analyze the performance of the single battery, which can improve the accuracy of the fuel cell performance simulation experiment.

    Embodiment of the present application further provides a performance analysis apparatus of a fuel cell catalytic layer, FIG. 4 is a structural schematic diagram of a performance analysis apparatus of a fuel cell catalytic layer provided in the embodiment of the present application, as shown in FIG. 4, the apparatus comprising:

    Building block 401, configured to perform a numerical model of the catalytic layer based on the scanning image of the catalytic layer to construct;

    The first determination module 402, configured to perform based on a numerical model, using the lattice Boltzmann method to simulate hydrodynamic behavior, to obtain solid phase distribution data and liquid water flow characteristic data; liquid water flow characteristic data include liquid water migration and redistribution characteristic data in the catalytic layer;

    The second determination module 403, configured to perform flow characteristic data based on liquid water, using a pore-scale model, to determine the diffusion rate of the gas and the conductivity of the charged substance in the numerical model;

    The third determination module 404, configured to perform the determination of the activation specific surface area based on the solid phase distribution data and the effective factor based on local saturation;

    The fourth determination module 405, is configured to perform based on the characteristic data of liquid water migration and redistribution in the catalytic layer, the diffusion rate of the gas, the conductivity of the charged substance and the specific surface area of activation, to obtain the performance parameters of the catalytic layer.

    Optionally, the scanned image is a grayscale image acquired from the catalytic layer by a focused ion beam scanning electron microscope;

    Building block 401, configured to execute:

    Determine the distribution area of each component in the catalytic layer corresponding to the grayscale image;

    Based on the distribution area corresponding to each component in the grayscale image, a numerical model of the catalytic layer is constructed in the preset calculation space.

    Optionally, a fifth determination module is also included, which is configured to execute: determine the effective factor according to the following formula (1):

    where β is the effective factor; S represents local saturation, characterizing the liquid water content of each local computing space based on the preset calculation space;

    The third determining module 404, configured to execute:

    Based on the solid-phase distribution data and the effective factor based on local saturation, the activation specific surface area is determined based on the following formula (2):

    where aV represents the specific surface area of activation, SPt and V are solid-phase distribution data, where SPt represents the area covered by the polymer electrolyte of the catalyst particles and V represents the volume of carbon-loaded platinum.

    Optionally, the unit also includes:

    Build a module that is configured to perform a three-dimensional macroscopic model of a single cell containing a catalytic layer;

    The sixth determination module, which is configured to perform performance parameters based on the 3D macroscopic model and the catalytic layer, determines the performance curve of a single cell, which includes a curve between battery voltage and average battery current density.

    Embodiments of the apparatus and method embodiments in the present application are based on the same application idea.

    Embodiments of the methods provided in the present application embodiment may be performed in a computer terminal, server, or similar computing device. Taking the server running as an example, FIG. 5 is a hardware block diagram of a fuel cell catalytic layer performance analysis method provided in the present application embodiment of the server. As shown in FIG. 5, the server 500 may produce relatively large differences due to different configurations or performance, may include one or more central processing units (Central Processing Units, CPU) 510 (processor 510 may include, but is not limited to, microprocessor NCU or programmable logic device FPGA and the like processing device), memory for storing data 530, one or more storage applications 523 or data storage medium 520 ( For example, one or one storage device in the amount of Shanghai). Wherein, the memory 530 and the storage medium 520 may be transient storage or persistent storage. The program stored in the storage medium 520 may include one or more modules, each module may include a series of instructions to the server operation. Further, the central processor 510 may be configured to communicate with the storage medium 520, performing a series of instruction operations in the storage medium 520 on the server 500. Server 500 may further include one or more power supplies 560, one or more wired or wireless network interfaces 550, one or more input and output interfaces 540, and / or, one or more operating systems 521, such as Windows, Mac OS, Unix, Linux, FreeBSD and the like.

    Input and output interface 540 may be used to receive or transmit data via a network. Specific examples of the above networks may include a wireless network provided by the communication provider of the server 500. In one example, the input and output interface 540 includes a network adapter (Network Interface Controller, NIC), which may be connected to other network devices through the base station to communicate with the Internet. In one example, the input and output interface 540 may be a radio frequency (RadioFrequency, RF) module for communicating with the Internet by wireless means.

    Those of ordinary skill in the art will appreciate that the structure shown in FIG. 5 is only illustrative, which does not qualify the structure of the above-described electronic device. For example, the server 500 may further comprise more or fewer components than shown in FIG. 5, or having a different configuration than shown in FIG. 5.

    Embodiments of the present application further provide a storage medium, the storage medium may be disposed in the server to save a method embodiment of a fuel cell catalytic layer performance analysis method related to at least one instruction, at least one program, code set or instruction set, the at least one instruction, the at least one program, the code set or instruction set by the processor loaded and executed to achieve the performance analysis method of the fuel cell catalytic layer.

    Alternatively, in the present embodiment, the storage medium may be located in at least one of the plurality of network servers on the computer network. Alternatively, in the present embodiment, the above-described storage medium may include, but is not limited to: a U disk, read-only memory (ROM, Read-Only Memory), random access memory (RAM, Random Access Memory), a removable hard disk, a magnetic disk or a disc and the like may store program code and other media.

    Embodiments of the performance analysis method, apparatus, apparatus and storage medium of the fuel cell catalytic layer provided by the above application can be seen, the present application constructs a numerical model of the catalytic layer by scanning the image based on the catalytic layer; based on the numerical model, the hydrodynamic behavior of the lattice Boltzmann method is used to simulate the hydrodynamic behavior, and the solid phase distribution data and the flow characteristic data of liquid water are obtained; the flow characteristic data of liquid water include the characteristic data of the migration and redistribution of liquid water in the catalytic layer; the flow characteristic data based on liquid water, using a pore scale model The specific surface area of activation is determined according to the solid phase distribution data and the effective factor based on local saturation, and the performance parameters of the catalytic layer are obtained based on the characteristic data of the migration and redistribution of liquid water in the catalytic layer, the diffusion rate of the gas, the conductivity of the charged substance and the specific surface area of activation. This application can realistically simulate the microscopic morphology of the catalytic layer under different water distribution conditions, and correct the ECSA by introducing an effective factor to reflect the negative impact of flooding on the activation of catalyst particles, so that the performance state of the catalytic layer of the fuel cell can be accurately evaluated.

    It should be noted that the above-mentioned sequence of embodiments of the present application is only for description and does not represent the advantages and disadvantages of the embodiments. And the above specific embodiments of the present specification are described. Other embodiments are within the scope of the appended claims. In some cases, the actions or steps recorded in the claims may be performed in a different order than in the embodiments and still the desired result may be achieved. Further, the process depicted in the drawings does not necessarily require a particular order shown or a continuous sequence to achieve the desired result. In certain embodiments, multitasking and parallel processing may also be or may be advantageous.

    Each embodiment in the present specification is described in a progressive manner, the same similar parts between each embodiment can be seen with each other, each embodiment focuses on the differences with other embodiments. In particular, for the device embodiment, because it is substantially similar to the method embodiment, the description is relatively simple, and the relevant points can be described in part of the method embodiment.

    Those of ordinary skill in the art will appreciate that all or part of the steps to implement the above embodiments may be completed by hardware, or may be completed by programs to instruct related hardware, the program may be stored in a computer-readable storage medium, the storage medium referred to above may be read-only memory, disk or optical disk and the like.

    The foregoing is only a preferred embodiment of the present application and is not intended to limit the present application, and any modifications, equivalent substitutions, improvements, etc. made within the spirit and principles of this application shall be included in the scope of protection of this application.

    展开 >
    交易服务流程
    >

    挑选中意的板块

    ----

    客服确认选择专利的交易信息和价格并支付相应款项

    办理转让材料

    ----

    协助双方准备相应的材料

    签订协议

    ----

    协助卖家签订协议

    办理备案手续

    ----

    买卖双方达成一致后

    交易完成

    ----

    交易完成可投入使用

    过户资料 & 安全保障 & 承诺信息
    >

    过户资料

    买卖双方需提供的资料
    公司 个人
    买家 企业营业执照
    企业组织机构代码证
    身份证
    卖家 企业营业执照
    专利证书原件
    身份证
    专利证书原件
    网站提供 过户后您将获得
    专利代理委托书
    专利权转让协议
    办理文件副本请求书
    发明人变更声明
    专利证书
    手续合格通知书
    专利登记薄副本

    安全保障

    承诺信息

    我方拟转让所持标的项目,通过中国汽车知识产权应用促进中心公开披露项目信息和组织交易活动,依照公开、公平、公正和诚信的原则作如下承诺:

    1、本次项目交易是我方真实意思表示,项目标的权属清晰,除已披露的事项外,我方对该项目拥有完全的处置权且不存在法律法规禁止或限制交易的情形;
    2、本项目标的中所涉及的处置行为已履行了相应程序,经过有效的内部决策,并获得相应批准;交易标的涉及共有或交易标的上设置有他项权利,已获得相关权利 人同意的有效文件。
    3、我方所提交的信息发布申请及相关材料真实、完整、准确、合法、有效,不存在虚假记载、误导性陈述或重大遗漏;我方同意平台按上述材料内容发布披露信息, 并对披露内容和上述的真实性、完整性、准确性、合法性、有效性承担法律责任;
    4、我方在交易过程中自愿遵守有关法律法规和平台相关交易规则及规定,恪守信息发布公告约定,按照相关要求履行我方义务;
    5、我方已认真考虑本次项目交易行为可能导致的企业经营、行业、市场、政策以及其他不可预计的各项风险因素,愿意自行承担可能存在的一切交易风险;
    6、我方在平台所组织交易期间将不通过其他渠道对标的项目进行交易;
    7、我方将按照平台收费办法及相关交易文件的约定及时、足额支付相关费用,不因与受让方争议或合同解除、终止等原因拒绝、拖延、减少交纳或主张退还相关费用。