Contents of the invention
The purpose of this application is to provide a pulse rating prediction method based on CLLSR hybrid model, which can improve the prediction accuracy of pulse force rating grade.
The application provides a pulse level prediction method based on a CLLSR hybrid model, comprising steps:
A1. obtaining a plurality of original pulse data, and carrying out pulse grade scoring and data preprocessing on the original pulse data, obtaining a plurality of sample data, forming a sample set; each sample data comprises pulse data after pretreatment and corresponding pulse grade label value;
A2. Divide the sample set into a training set and a test set;
A3.Construct a CLLSR hybrid neural network model based on CNN neural network and LSTM neural network;
A4. taking the preprocessed pulse image data in the sample data as the model input of the CLLSR hybrid neural network model, and taking the pulse level prediction value as the model output of the CLLSR hybrid neural network model, using the training set to train the CLLSR hybrid neural network model, and testing the trained CLLSR hybrid neural network model with the test set to obtain the trained CLLSR hybrid neural network model;
A5. The trained CLLSR hybrid neural network model is used to predict the pulse level based on the measured pulse data of the object to be measured.
Through the pulse rating and data preprocessing of the original pulse data, an expert dataset with pulse level labels (i.e., pulse level label values) was constructed, based on which the CLLSR hybrid neural network model was trained, and the accuracy of the prediction results could be improved by using the trained CLLSR hybrid neural network model for pulse level prediction.
Preferably, in step A1, the steps for obtaining a plurality of raw pulse data comprise:
For a plurality of subjects, a plurality of pulse data under different prepressures are collected at the pulse position of the inch-mouth gate of each subject through a pressure sensor, and are recorded as the first pulse data;
From a plurality of first pulse data corresponding to different prepressures of the same subject, an optimal pulse data is screened as the original pulse data of the corresponding subject.
Using multiple prepressures for the same subject to collect pulse data, and selecting the best as effective data can improve the clarity of the pulse data obtained, so that the obtained pulse data can better reflect the real pulse fluctuation of the subject.
Preferably, in step A1, data preprocessing of the raw pulse data comprises:
The sliding-MEAN algorithm was used to smooth the original pulse data;
Identify the peak and trough points in the smoothed original pulse data;
intercepting multi-segment single-period wave data from the smoothed original pulse data according to the peak point and the valley point;
the intercepted multi-segment single-period wave data are aligned with data points;
Calculate the similarity distance between the two pairs of the aligned multi-segment single-period wave data.
according to the similarity distance, the aligned multi-segment single-period wave data are screened to obtain multi-segment reference single-period wave data;
calculating the average single-period wave data of the reference single-period wave data is used as the effective single-period wave data, and the pulse data after the pretreatment is the effective single-period wave data.
The effective single-period wave data obtained by the above method can effectively remove the interference of abnormal fluctuation data and abnormal points in the original pulse data, so that the effective single-period wave data can more truly reflect the real pulse fluctuation of the subjects.
Preferably, Step A1 also includes:
random noise is added to the calculated effective single-period wave data to obtain a new effective single-period wave data;
the pulse level label value corresponding to the effective single-period wave data before adding noise is taken as the corresponding pulse level label value of the new effective single-period wave data.
Preferably, the steps for calculating the similarity distance between two pairs of the aligned multi-segment single-period wave data comprise:
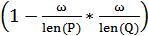
The similarity distance between pairs of aligned multi-segment single-period wave data is calculated according to the following formula:
![]() ;
wherein, P and Q are the two single-period wave data after alignment, the![]() similarity distance between P and Q,
![]() the longest common substring between P and Q,
![]() the
![]() data length of P and Q respectively,
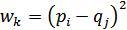
![]() the Euclidean distance between the k-th registration elements between P and Q,
![]() i is the ordinal number of the elements belonging to P in the k-th registration element, and j is the ordinal number
![]() of the elements belonging to Q in the k-th registration elementis the element belonging to P in the k-registration element,
![]() is the element belonging to Q in the k-registration element, and K is the number of groups of registration elements between P and Q.
Preferably, the CLLSR hybrid neural network model comprises a sequentially connected input layer, a three-layer one-dimensional CNN neural network, a two-layer LSTM neural network, a fully connected layer, a label smoothing regularization layer and an output layer.
Preferably, the activation function in the LSTM neural network is the ELU activation function.
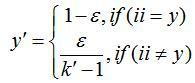
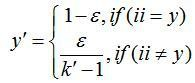
Preferably, the processing function of the label smoothing regularization layer to smooth the label is:
![]() ;
Among them, it![]() is the new label after smoothing, the
![]() real label,
![]() the hyperparameter, the
![]() number of categories, and
![]() the category corresponding to the smoothed label.
Preferably, Step A4 includes:
input the preprocessed pulse data in the sample data of the training set into the CLLSR hybrid neural network model, and obtain the prediction results output by the CLLSR hybrid neural network model;
calculating the loss function according to the prediction result and the corresponding pulse grade label value in the sample data;
If the loss function satisfies the preset stopping condition, the training is stopped;
if the loss function does not satisfy the preset stopping condition, the Adam optimizer is used to optimize the model parameters of the CLLSR hybrid neural network model, and the above training steps are repeated based on the next sample data in the training set;
After the training is stopped, the test set is used to cross-verify the trained CLLSR hybrid neural network model, and the trained CLLSR hybrid neural network model is obtained after the verification is passed.
Preferably, the loss function is the mean absolute percentage error or the logarithmic error of mean square.
Beneficial effect: The pulse level prediction method based on the CLLSR hybrid model provided in this application constructs an expert dataset with pulse level labels (i.e., pulse level label values) through pulse rating and data preprocessing of the original pulse data, based on which the CLLSR hybrid neural network model is trained, and the accuracy of the prediction results can be improved by using the trained CLLSR hybrid neural network model for pulse level prediction.
The specific embodiment
The technical solutions in the embodiments of the present application will be clearly and completely described below in conjunction with the accompanying drawings in the embodiments of the present application, and it is obvious that the described embodiments are only part of the embodiments of the present application, not all embodiments. The components of the embodiment of the present application, which are normally described and shown in the drawings herein, may be arranged and designed in a variety of different configurations. Therefore, the following detailed description of the embodiments of the present application provided in the drawings is not intended to limit the scope of the claimed application, but merely indicates the selected embodiments of the present application. Based on the embodiments of the present application, all other embodiments obtained by a person skilled in the art without creative work fall within the scope of protection of the present application.
It should be noted that similar designations and letters indicate similar terms in the drawings below, so that once an item is defined in a drawing, it does not need to be further defined and explained in subsequent drawings. At the same time, in the description of the present application, the terms "first", "second", etc., are only used to distinguish the description and cannot be construed as indicating or implying relative importance.
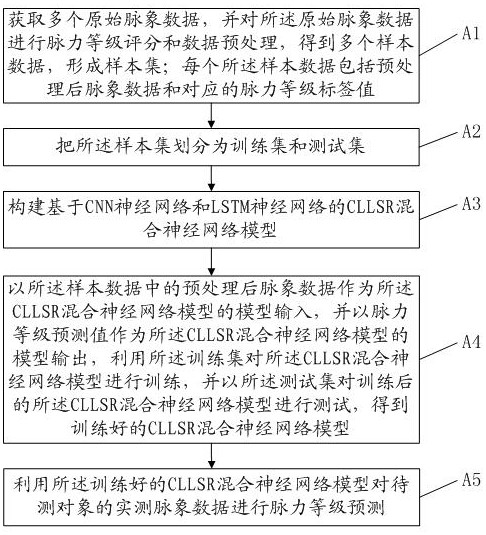
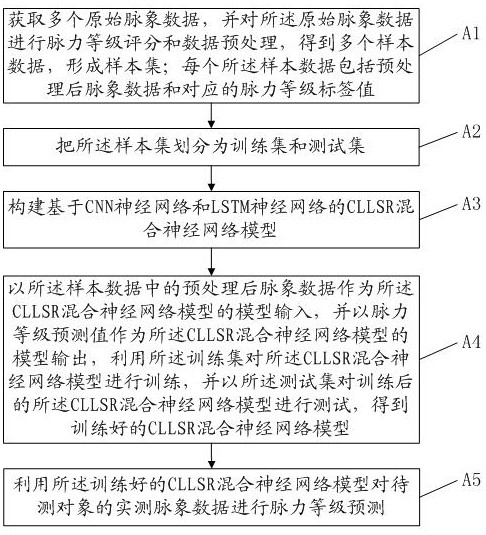
Please refer to FIG. 1, FIG. 1 is a pulse rating prediction method based on CLLSR hybrid model in some embodiments of the present application, comprising steps:
A1. Obtain a plurality of raw pulse data, and perform pulse grade scoring and data preprocessing on the original pulse data to obtain a plurality of sample data to form a sample set;
A2.Divide the sample set into a training set and a test set;
A3.Construct a CLLSR hybrid neural network model based on CNN neural network and LSTM neural network;
A4.The preprocessed pulse data in the sample data was used as the model input of the CLLSR hybrid neural network model, and the pulse level prediction value was used as the model output of the CLLSR hybrid neural network model, and the CLLSR hybrid neural network model was trained by the training set, and the trained CLLSR hybrid neural network model was tested with the test set to obtain the trained CLLSR hybrid neural network model.
A5.The trained CLLSR hybrid neural network model is used to predict the pulse level of the measured pulse data of the test object.
Through the pulse rating and data preprocessing of the original pulse data, an expert dataset (i.e., sample set) with pulse rating (i.e., pulse rating label value) was constructed, based on which the CLLSR hybrid neural network model was trained, and the accuracy of the prediction results could be improved by using the trained CLLSR hybrid neural network model for pulse level prediction.
In fact, for the same subject, the pre-pressure of the pressure sensor (i.e., the pressure of the pressure sensor at the pulse position of the inch-mouth pass) is different, and the amplitude of the collected pulse data is different, and the larger the amplitude of the pulse data, the clearer the data characteristics, therefore, each subject has the corresponding optimal pre-pressure, and the optimal pre-pressure of different subjects is generally different.
Preferably, in Step A1, the steps to acquire multiple raw pulse data include:
For multiple subjects, a number of pulse data under different prepressures were collected at the pulse position of each subject's inch-mouth gate through a pressure sensor, which was recorded as the first pulse data;
From the multiple first pulse data corresponding to different prepressures of the same subject, an optimal pulse data was selected as the original pulse data of the corresponding subject.
Using multiple prepressures for the same subject to collect pulse data, and selecting the best as effective data can improve the clarity of the pulse data obtained, so that the obtained pulse data can better reflect the real pulse fluctuation of the subject.
Among them, the gradient of the pre-pressure applied to each subject (refers to the number of pre-pressure, for example, if 10 different pre-pressures are applied to the subject, the gradient number of pre-pressure is 10) and the corresponding pressure value can be set according to actual needs. For example, 10 gradients of prepressure are applied to each subject, and the prepressure of each gradient corresponds to the collection of a first pulse data, which are 50g, 70g, 90g, 110g, 130g, 150g, 170g, 190g, 210g, and 230g, but are not limited to 10 gradients, and the pressure value of each gradient is not limited to this.
Among them, when collecting the first pulse data, the data can be collected according to the preset sampling frequency (which can be set according to actual needs) and the preset duration (which can be set according to actual needs, such as 5s).
Wherein, from the plurality of first pulse data corresponding to different prepressures of the same subject, the steps of screening an optimal pulse data as the original pulse data of the corresponding subjects may include: selecting the first pulse data with the largest amplitude of the pulse data as the original pulse data of the corresponding subjects from the plurality of first pulse data corresponding to different prepressures of the same subject.
Preferably, in step A1, data preprocessing of the raw pulse data includes:
The sliding-MEAN algorithm was used to smooth the original pulse data.
Identify the peak and trough points in the smoothed original pulse data;
According to the peak point and valley point, the multi-segment single-period wave data was intercepted from the smoothed original pulse data.
The intercepted multi-segment single-period wave data is aligned with data points.
Calculate the similarity distance between the two pairs of the aligned multi-segment single-period wave data.
According to the similarity distance, the aligned multi-segment single-period wave data was screened to obtain multi-segment reference single-period wave data.
The average single-period wave data of the reference single-period wave data is calculated as the effective single-period wave data, and the pulse data after preprocessing is the effective single-period wave data.
The effective single-period wave data obtained by the above method can effectively remove the interference of abnormal fluctuation data and abnormal points in the original pulse data, so that the effective single-period wave data can more truly reflect the real pulse fluctuation of the subjects.
Among them, the sliding-mean algorithm (moving average algorithm) is used to smooth the original pulse data, which can remove the baseline drift caused by breathing or other noise, and facilitate the identification of pulse peak and trough points. The sliding-mean algorithm is an existing art and is not described in detail here.
Among them, the existing peak-to-valley identification algorithm can be used to identify the peak and trough points in the smoothed original pulse data, which are not described in detail here.
Among them, the data between any adjacent peak and trough points in the original pulse data is a single-period wave data.
Among them, the cubic spline interpolation method can be used to align the data points of the intercepted multi-segment single-period wave data, which is the prior art and is not described in detail here. After the data point alignment process, the data length of each segment of single-period wave data is the same. Through cubic spline interpolation, the influence of outliers on the overall waveform can be weakened to a certain extent.
Among them, the steps to calculate the similarity distance between two pairs of multi-segment single-period wave data after alignment processing include:
The similarity distance between pairs of aligned multi-segment single-period wave data is calculated according to the following formula:
![]() ;
Among them, P and Q are the two single-period wave data after alignment (P and Q can be any two single-period wave data after alignment, that is, the similarity distance between any two single-period wave data after alignment is calculated by the above formula),![]() which is the similarity distance between P and Q,
![]() which is the longest common substring between P and Q,
![]() and
![]() the data length
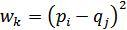
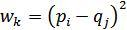
![]() of P and Q respectivelyis the Euclidean distance between the k-th registration elements between P and Q (a set of registration elements comprises two elements, one of which belongs to P and the other belongs to Q, and the registration relationship between the two elements is determined by a registration algorithm, and the registration algorithm is a prior art, which is not described in detail here),
![]() where i is the ordinal number of the element belonging to P in the k-th group registration element, j is the ordinal number of the element belonging to Q in the k-group registration element, and
![]() is the element
![]() belonging to P in the k-group registration elementis the element belonging to Q in the k-registration element, and K is the number of groups of registration elements between P and Q. Through the terms in the
![]() above equation, the similarity distance between the two single-period wave data with high similarity can be ensured to be close to 0, so as to facilitate the subsequent data screening.
Among them, the steps to obtain the multi-segment reference single-period wave data after the alignment processing are screened according to the similarity distance can include:
The single-period wave data of each segment after alignment were used as the target single-period wave data.
The number of matching single-period wave data corresponding to each target single-period wave data is counted by taking other single-period wave data with the similarity distance of the target data less than the preset similarity distance threshold (which can be set according to actual needs) as the matching single-period wave data of the target single-period wave data.
Select the target single-period wave data with the largest number of matching single-period wave data and the corresponding matching single-period wave data as the reference single-period wave data (for example, assuming that the target single-period wave data with the largest number of matching single-period wave data is single-period wave data A, and the matching single-period wave data of single-period wave data A includes single-period wave data B, single-period wave data C, and single-period wave data D, then the reference single-period wave data includes single-period wave data A, single-period wave data B, Single-period wave data C and single-period wave data D).
By screening the reference single-period wave data in the above way, the most data can be retained, so that the original pulse data can be used most repeatedly, which is conducive to making the final effective single-period wave data more truly reflect the real pulse fluctuation of the subject.
When calculating the average single-period wave data, the average value of the elements in the same order in each reference single-period wave data is calculated as the corresponding sorted elements in the average single-period wave data. For example, calculate the average of the first element of reference single-period wave data A, reference single-period wave data B, reference single-period wave data C, and reference single-period wave data D as the first element of average single-period wave data E, calculate the average of the second element of reference single-period wave data A, reference single-period wave data B, reference single-period wave data C, and reference single-period wave data D as the second element of average single-period wave data E, and so on.
Specifically, in step A1, the TCM expert judges the pulse of the subject, scores the pulse force of the subject, and takes the scoring result as the pulse rating score of the subject's original pulse data and the corresponding pulse grade label value of the effective single-cycle wave data. Therefore, the final sample set is an expert dataset supported by the experience of TCM experts, which ensures the accuracy and interpretability of the prediction results of the CLLSR hybrid neural network model trained by using this sample set. The pulse rating can range from 0-100, and thus, the pulse rating tag value is 0-100, but not limited to.
Among some preferred embodiments, step A1 also includes:
Random noise is added to the calculated effective single-period wave data to obtain a new effective single-period wave data.
The pulse level label value corresponding to the effective single-period wave data before the noise is added is used as the corresponding pulse level label value of the new effective single-period wave data.
Data augmentation in the above methods can expand the data volume of the sample set and ensure that there is enough data to train the CLLSR hybrid neural network model.
Among them, when adding noise, different kinds of noise (such as white noise, Gaussian noise, etc.) to generate a plurality of new effective single-period wave data containing different kinds of noise, wherein, for the same kind of noise, noise of different intensity ranges (which can be set according to actual needs) can be randomly added to the same effective single-period wave data respectively to obtain a plurality of new effective single-period wave data containing the same kind of noise but different noise intensities (for example, a first intensity is randomly determined in the preset intensity range one, so as to generate a noise containing the first intensity, a noise can refer to any kind of noise, and a second intensity is randomly determined in the preset intensity range twoto generate a new effective single-period wave data containing a noise of second intensity). By adding different noises to achieve data augmentation, the generalization ability of the CLLSR hybrid neural network model can be improved to a certain extent.
In step A2, the sample set can be divided into a training set and a test set according to a preset ratio (set according to actual needs), for example, the preset ratio is 7.5:2.5, but not limited to.
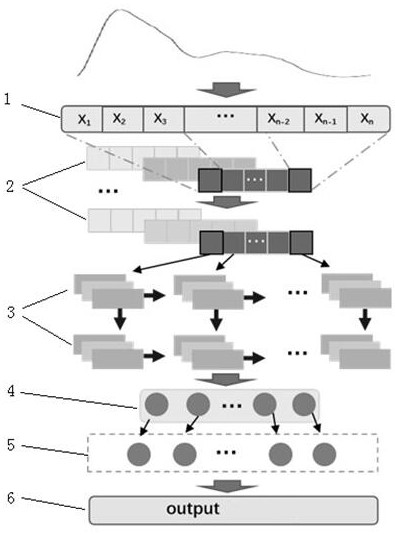
In some embodiments, see Figure 2, the CLLSR hybrid neural network model comprises a sequentially connected input layer 1, a three-layer one-dimensional CNN neural network 2 (a one-dimensional convolutional neural network), a two-layer LSTM neural network 3 (a long short-term memory neural network), a fully connected layer 4, a label smoothing regularization layer 5, and an output layer 6.
Among them, X1-Xn in the input layer 1 in Figure 2 represents the elements of the input single-period wave data, and n is the number of elements of the input single-period wave data (i.e., the characteristic dimensions of the input single-period wave data).
Among them, the one-dimensional CNN neural network 2 uses maximum pooling to reduce the feature dimension after convoluting the input data.
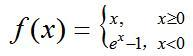
Among them, the activation function in LSTM neural network 3 is the ELU activation function. The ELU activation function is:
![]() where x is the independent variable, which is the
![]() ELU activation function, and e is the natural logarithmic base.
Among them, the fully connected layer 4 is used to convert the features of the output result of LSTM neural network 3 into a one-dimensional vector.
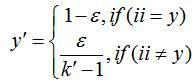
Wherein, the label smoothing regularization layer 5 is used to smooth the unbalanced labels. Preferably, the processing function of label smoothing regularization layer 5 for label smoothing is as follows:
![]() ;
Among them, it![]() is the new label after smoothing, the
![]() real label,
![]() the hyperparameter, the
![]() number of categories, and
![]() the category corresponding to the smoothed label.
Preferably, Step A4 includes:
A401. input the preprocessed pulse data in the sample data of the training set into the CLLSR hybrid neural network model, and obtain the prediction results output by the CLLSR hybrid neural network model;
A402. Calculate the loss function according to the prediction result and the pulse level label value in the corresponding sample data;
A403. If the loss function satisfies the preset stop condition, the training will be stopped.
A404. If the loss function does not meet the preset stop condition, the Adam optimizer is used to optimize the model parameters of the CLLSR hybrid neural network model, and then repeat the above training steps (i.e., steps A401-A404) based on the next sample data in the training set;
A405. After the training is stopped, the test set is used to cross-verify the trained CLLSR hybrid neural network model, and the trained CLLSR hybrid neural network model is obtained after the verification is passed.
Preferably, the loss function is either the mean absolute percentage error or the logarithmic error of mean square.
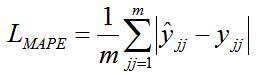
The average absolute percentage error is:
![]() ;
![]() is the average absolute percentage error, jj is the ordinal number, is the
![]() training sample data of jj (i.e., the sample data used in the training iteration of jj),
![]() is the prediction result of jj (i.e., the prediction result output of the CLLSR hybrid neural network model in the training iteration of jj), and m is the total number of training sample data that has been used (equal to the total number of training iterations).
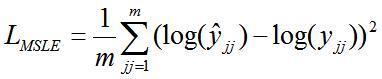
Wherein, the logarithmic error of mean square is:
![]() 。
For example, the preset stop condition is less than the preset loss function threshold (which can be set according to actual needs), but is not limited to.
Among them, the process of using the Adam optimizer to optimize the model parameters is the prior art, which is not described in detail here.
The process of cross-validating using test sets is prior art and is not described in detail here.
Step A5 includes:
Collect a plurality of pulse data under different prepressures through the pressure sensor at the pulse position of the inch-mouth gate of the object to be measured, which is recorded as the second pulse data (refer to the collection process of the first pulse data above);
From a plurality of second pulse data, an optimal pulse data was selected as the measured pulse data of the corresponding subjects (refer to the screening process of the original pulse data above).
The measured pulse data is preprocessed to obtain the corresponding effective single-period wave data (refer to the preprocessing process above), which is recorded as the effective measured single-period wave data.
The effective measured single-period wave data is input into the trained CLLSR hybrid neural network model, and the pulse level prediction value output by the trained CLLSR hybrid neural network model is obtained.
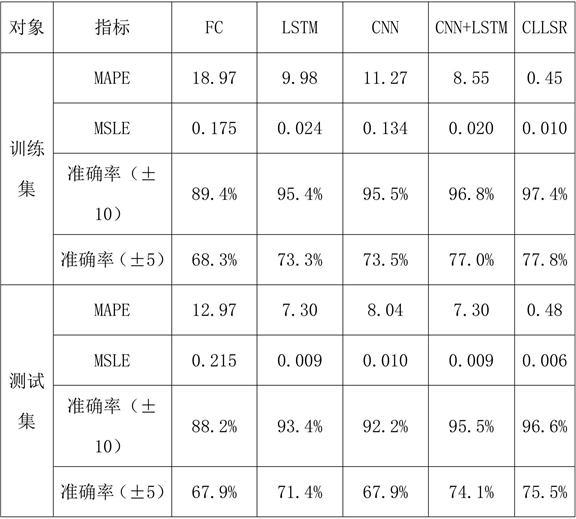
The pulse level prediction of the sample data of the training set and the test set was carried out by using a single fully connected layer (FC), a single LSTM neural network (LSTM), a single CNN neural network (CNN), an existing neural network model combining LSTM and CNN (CNN+LSTM), and the above-mentioned CLLSR hybrid neural network model (CLLSR), respectively, and the prediction results are shown in Table 1.
Table 1
![]() ;
In Table 1, the indicator MAPE represents the mean absolute percentage error, the indicator MSLE represents the mean square logarithmic error, the accuracy (±10) represents the prediction accuracy of the sample data ± 10 points in the pulse level range, and the accuracy (±5) represents the prediction accuracy of the sample data ± 5 points in the pulse level range. As can be seen from the table, the CLLSR hybrid neural network model of this application has the highest accuracy in prediction results.
In summary, the pulse level prediction method based on the CLLSR hybrid model in the present application has the following advantages:
After a series of preprocessing of the original pulse data, and the pulse rating was carried out by TCM experts, an expert dataset with pulse grade label values was constructed. The DTW algorithm is used to eliminate the abnormal fluctuation data in the single-period wave data, and the average method is used to obtain the effective single-period wave data from the single-period wave data that eliminates abnormal fluctuations, and the averaging method can effectively remove the interference of abnormal points in the original pulse data. The data augmentation of the sample set is achieved by adding different noises to the effective single-period wave data, which improves the generalization ability of the model to a certain extent. The CLLSR hybrid neural network model can reduce the error of manual judgment of pulse force and improve the prediction accuracy and interpretability.
For the purposes of this article, relational terms such as first and second, etc., are used solely to distinguish one entity or operation from another, and do not necessarily require or imply any such actual relationship or sequence between those entities or operations.
The foregoing is only an embodiment of the present application and is not intended to limit the scope of protection of the present application, which is subject to various changes and variations for those skilled in the art. Any amendments, equivalent replacements, improvements, etc., made within the spirit and principles of this application shall be included in the scope of protection of this application.


































 400-4929-0909
 contact@catarc.com.cn